. 2008 Jul 3;454(7200):109-13.
doi: 10.1038/nature07060. Epub 2008 Jun 22.

Epicardial progenitors contribute to the cardiomyocyte lineage in the developing heart

Affiliations

Epicardial progenitors contribute to the cardiomyocyte lineage in the developing heart

Bin Zhou et al. Nature. .

Abstract

The heart is formed from cardiogenic progenitors expressing the transcription factors Nkx2-5 and Isl1 (refs 1 and 2). These multipotent progenitors give rise to cardiomyocyte, smooth muscle and endothelial cells, the major lineages of the mature heart. Here we identify a novel cardiogenic precursor marked by expression of the transcription factor Wt1 and located within the epicardium-an epithelial sheet overlying the heart. During normal murine heart development, a subset of these Wt1(+) precursors differentiated into fully functional cardiomyocytes. Wt1(+) proepicardial cells arose from progenitors that express Nkx2-5 and Isl1, suggesting that they share a developmental origin with multipotent Nkx2-5(+) and Isl1(+) progenitors. These results identify Wt1(+) epicardial cells as previously unrecognized cardiomyocyte progenitors, and lay the foundation for future efforts to harness the cardiogenic potential of these progenitors for cardiac regeneration and repair.


Figures
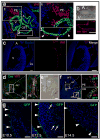
Fig. 1
Fig. 1. Cardiac Wt1 and Wt1-driven GFPCre expression
a. At E9.5, Wt1 was expressed in proepicardium (PE) and in scattered pericardial cells over the surface of the heart (arrowheads, a2). b-c. At E15.5, Wt1 expression was confined to the epicardium, as determined by in situ hybridization (ISH, b) and immunohistochemistry. d-f. Co-expression of Wt1 and GFPCre expression in Wt1GFPCre/+ E9.5 embryos. Wt1 and GFPCre were co-expressed in PE and urogenital ridge (UR). g. Wt1-driven GFPCre was confined to epicardium (arrowheads), and not detected within myocardium, at E9.5-E15.5 (representative images for E10.5, E12.5, and E14.5 are shown). Arrows indicate autofluorescent red blood cells. All images except b show immunohistochemical staining. A, atrium. V, ventricle. LV and RV, right and left ventricle. Lu, lung. OFT, outflow tract. Scale bars: 50 ⌠m.
Fig. 2
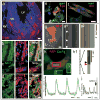
Fig. 2. Wt1-derived cells differentiate into cardiomyocytes
The fate of Wt1-derived cells, marked by ®-gal expression in Wt1GFPCre/+; Rosa26fsLz hearts (a-c,e), or RFP expression in Wt1GFPCre/+;Z/Red hearts (d,f,g-j), was analyzed by immunohistochemistry (a-f) and live cell imaging (g-j). a. Overview of contribution of Wt1-derived cells to myocardium. b-d. Cryosections of E15.5 heart stained for genetic lineage tracers (β-gal or RFP) and cardiomyocyte-specific markers Tnnt2 and Actn1. e-f. Co-expression of genetic lineage tracers with cardiomyocyte markers in dissociated E15.5 heart culture. g-j. Live cell imaging of Wt1-derived cells, identified by RFP fluorescence. g. Spontaneous contraction of an RFP+ cells. Transmission line scan along the paths indicated by dashed lines. Arrowheads indicate contraction of an RFP+ cell (g1). A non-contractile cell is shown in g2. h. Fluo-4 AM calcium imaging of a cluster of beating cells, one of which was RFP+. Calcium oscillations in the RFP+ cell, measured by line scan along the white line, showed calcium sparks (black arrowhead, h1) preceding calcium waves (red arrowhead). i. Calcium oscillations in the RFP+ cell was synchronized with adjacent cardiomyocytes, indicating electrical coupling. Plots correspond to scans within colored boxes shown in h. j. Caffeine augmentation of the amplitude of calcium oscillations in an RFP+ cell. Blue staining, a-f, DAPI. Scale bars: a, 50 ⌠m, others 10 μm.
Fig. 3
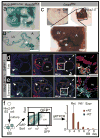
Fig. 3. Wt1-expressing epicardial cells differentiate into cardiomyocytes
a-h. Temporal restriction of Cre labeling with Wt1CreERT2. Wt1CreERT2 did not recombine the fate mapping reporter Rosa26fsLz in the absence of tamoxifen (b). Tamoxifen treatment at E10.5 and E11.5 induced Wt1CreERT2 labeling of cardiomyocytes, as determined in both tissue sections (c) and in dissociated heart culture (g-h). Also labeled were SMCs adjacent to endothelial tubes (d-e). i-k. E11.5 Wt1GFPCre/+ heart cells actively expressing Wt1, as determined by GFP fluorescence, differentiated into cardiomyocytes. Wt1+ epicardial cells were enriched in early digestion fractions compared to late digestion fractions. GFP+ cells from early fractions were plated either with mitotically inactivated feeders (j) or without feeders (k). l-m. CMFDA dye, selectively incorporated into E11.5 epicardium, was found in CMs at 48 hours. Brief incubation of E11.5 heart explants with the dye CMFDA resulted in selective labeling of epicardium (0 hours culture). After 48 hours in explant culture, dye labeled cells were present in the myocardial wall. A subset of dye-labeled cells co-expressed the CM markers Nkx2-5, cardiac troponin I (Tnni3), and Actn1. Arrows indicate co-expression. Scale bars: 10 ⌠m.
Fig. 4
Fig. 4. Proepicardium arises from Nkx2-5+ precursors
a-c. The Nkx2-5 fate map was determined in Nkx2-5IRES-Cre; Rosa26fsLz (a-b) or Nkx2-5Cre; Gata4flap (c) embryos. Nkx2-5-driven Cre activated lineage tracer expression in PE (asterisk). d. Nkx2-5 fate, marked by expression of alkaline phosphatase (AP, red membrane staining) compared to Wt1 immunohistochemistry (green nuclear staining). Wt1 was expressed in Nkx2-5-derived cells in PE (white arrowhead). e. Immunohistochemistry comparing Nkx2-5 (red) and Wt1 expression (green). Yellow arrowhead indicates anterior heart field, which did not express Wt1. f.Nkx2-5gfp ES cells were differentiated in embryoid body (EB) culture for the indicated number of days. The cells were then dissociated, and GFP+ cells were isolated by flow cytometry. Wt1 expression in GFP+ cells was measured by quantitative reverse transcription PCR. Bars indicate mean ± sd. n=3. Scale bars: 50 ⌠m. A, atrium . RV, right ventricle. LV, left ventricle. OFT, outflow tract.

Similar articles

Cited by

References

    1. Martin-Puig S, Wang Z, Chien KR. Lives of a heart cell: tracing the origins of cardiac progenitors. Cell Stem Cell. 2008;2:320–331. - PubMed
    1. Laugwitz KL, Moretti A, Caron L, Nakano A, Chien KR. Islet1 cardiovascular progenitors: a single source for heart lineages? Development. 2008;135:193–205. - PubMed
    1. Moretti A, et al. Multipotent embryonic isl1+ progenitor cells lead to cardiac, smooth muscle, and endothelial cell diversification. Cell. 2006;127:1151–1165. - PubMed
    1. Wu SM, et al. Developmental origin of a bipotential myocardial and smooth muscle cell precursor in the mammalian heart. Cell. 2006;127:1137–1150. - PubMed
    1. Manner J, Perez-Pomares JM, Macias D, Munoz-Chapuli R. The origin, formation and developmental significance of the epicardium: a review. Cells Tissues Organs. 2001;169:89–103. - PubMed

Publication types

MeSH terms