

Quality leadership and quality control
- PMID: 18568046
- PMCID: PMC1853339
Quality leadership and quality control
Abstract
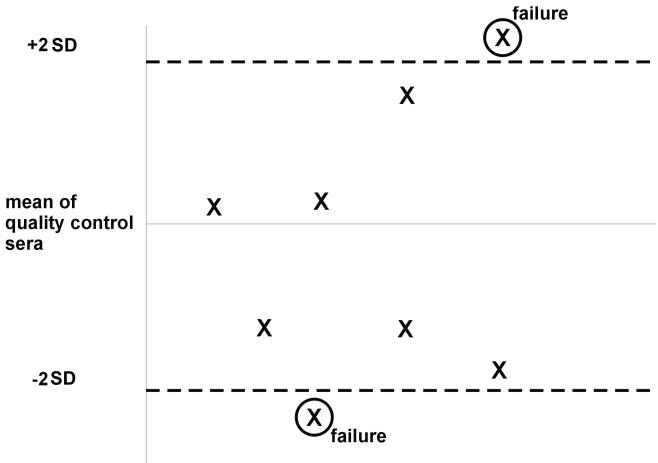
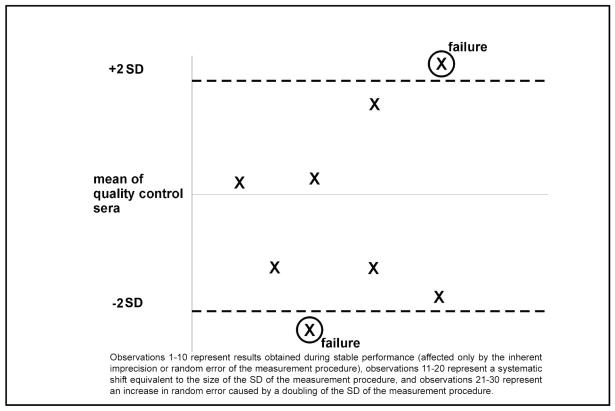
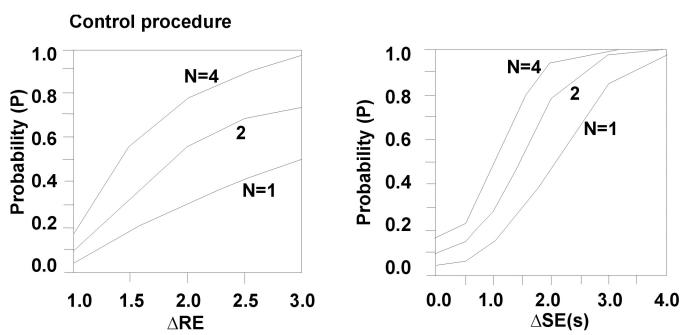
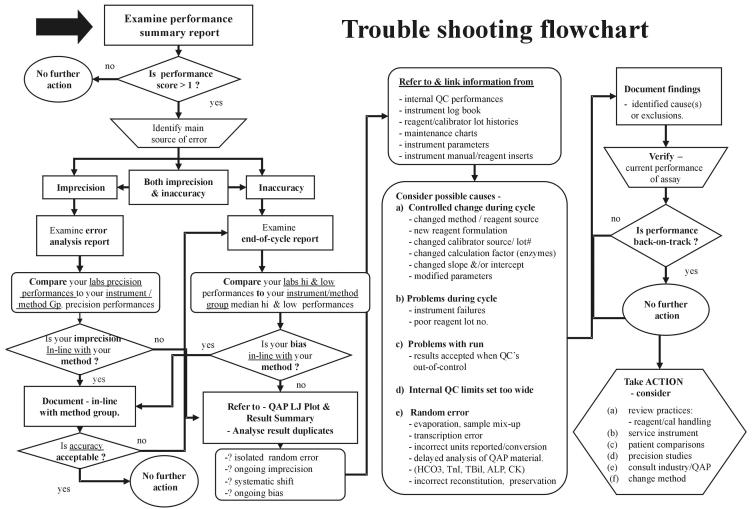
Different quality control rules detect different analytical errors with varying levels of efficiency depending on the type of error present, its prevalence and the number of observations. The efficiency of a rule can be gauged by inspection of a power function graph. Control rules are only part of a process and not an end in itself; just as important are the trouble-shooting systems employed when a failure occurs. 'Average of patient normals' may develop as a usual adjunct to conventional quality control serum based programmes. Acceptable error can be based on various criteria; biological variation is probably the most sensible. Once determined, acceptable error can be used as limits in quality control rule systems. A key aspect of an organisation is leadership, which links the various components of the quality system. Leadership is difficult to characterise but its key aspects include trust, setting an example, developing staff and critically setting the vision for the organisation. Organisations also have internal characteristics such as the degree of formalisation, centralisation, and complexity. Medical organisations can have internal tensions because of the dichotomy between the bureaucratic and the shadow medical structures.
Figures
References
-
- Glick JH. Osmometric estimation of vial-to-vial variation in contents of lyophilised sera. Clin Chem. 1977;23:781–2. - PubMed
-
- Burtis CA, Ashwood ER (eds) Tietz Fundamentals of Clinical Chemistry, (second edition), WB Saunders, Philadelphia, 1994.
-
- Cembrowski GS, Carey RN. Laboratory Quality Management. ASCP Press, Chicago. 1986.
-
- Westgard JO, Barry PL. Cost-effective quality control: managing the quality and productivity of analytical processes. AACC Press, Washington. 1986.
-
- Westgard QC Homepage. http://www.westgard.com
LinkOut - more resources
Full Text Sources