. 2008 Jun;21(6):367-88.
doi: 10.1080/14767050802045848.

Proteomic analysis of amniotic fluid to identify women with preterm labor and intra-amniotic inflammation/infection: the use of a novel computational method to analyze mass spectrometric profiling

Affiliations

Proteomic analysis of amniotic fluid to identify women with preterm labor and intra-amniotic inflammation/infection: the use of a novel computational method to analyze mass spectrometric profiling

Roberto Romero et al. J Matern Fetal Neonatal Med. 2008 Jun.

Abstract

Objective: Examination of the amniotic fluid proteome has been used to identify biomarkers for intra-amniotic inflammation as well as those that may be useful in predicting the outcome of preterm labor. The purpose of this study was to combine a novel computational method of pattern discovery with mass spectrometric proteomic profiling of amniotic fluid to discover biomarkers of intra-amniotic infection/inflammation (IAI).

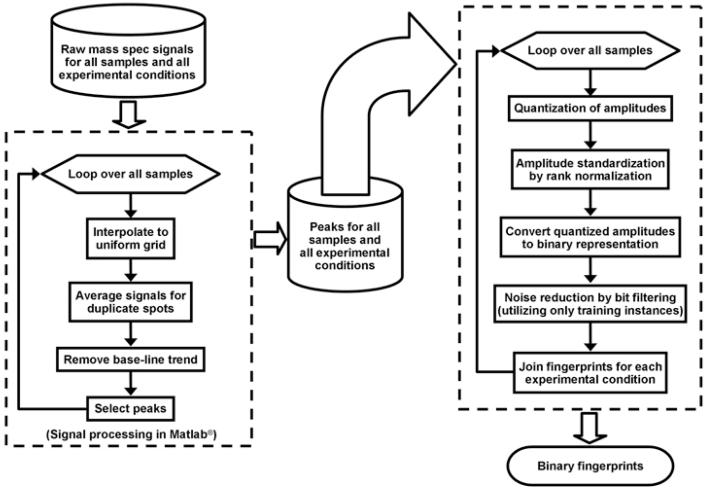
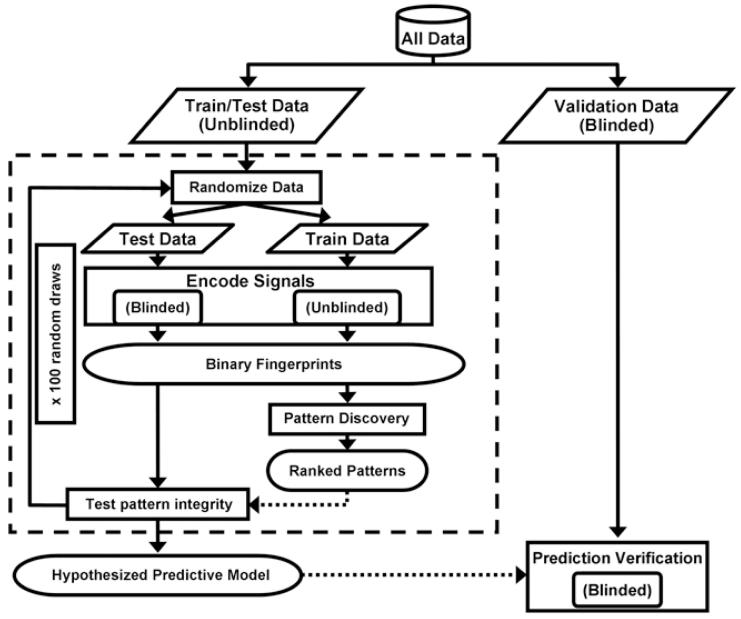
Methods: This cross-sectional study included patients with spontaneous preterm labor and intact membranes who delivered at term (n = 59) and those who delivered preterm with IAI (n = 60). Proteomic profiling was performed using surface-enhanced laser desorption/ionization (SELDI) mass spectrometry. A proteomic profile was acquired through multiple simultaneous SELDI conditions, which were combined in a single proteomic 'fingerprint' using a novel computational approach. Classification of patients based on their associated surface-enhanced laser desorption/ionization-time of flight (SELDI-TOF) mass spectra as belonging to either the class of individuals with preterm delivery with IAI or term delivery was accomplished by constructing an empirical model. The first phase in the construction of this empirical model involved the selection of adjustable parameters utilizing a training/testing subset of data. The second phase tested the generalization of the model by utilizing a blinded validation set of patients who were not employed in parameter selection.

Results: Gestational age at amniocentesis was not significantly different between the groups. Thirty-nine unique mass spectrometric peaks discriminated patients with preterm labor/delivery with IAI from those with preterm labor and term delivery. In the testing/training dataset, the classification accuracies (averaged over 100 random draws) were: 91.4% (40.2/44) for patients with preterm delivery with IAI, and 91.2% (40.1/44) for term delivery. The overall accuracy of the classification of patients in the validation dataset was 90.3% (28/31).

Conclusions: Proteomic analysis of amniotic fluid allowed the identification of mass spectrometry features, which can distinguish patients with preterm labor with IAI from those with preterm labor without inflammation or infection who subsequently delivered at term.


Figures

Figure 1
Figure 1
Flowchart describing the elements involved in the transformation of raw mass spectrometry tracings to binary fingerprints necessary for pattern discovery. This flowchart consists of two major units denoted by dashed boxes. The box on the left side of this figure represents the processes conventionally referred to as “signal processing” in the engineering community. The box on the right side of the figure describes processes needed to transform signal data into a binary categorical description. Raw mass spectrometry files, stored as text files on computer disk, are first processed by computer programs written in the MATLAB® language. These processes are represented as rectangular boxes on the left side of this figure. Each mass spectrometry tracing is first interpolated to a uniform grid of m/z values. Next, signals corresponding to duplicate spots on the protein chip arrays are averaged. Then, the baseline trend for this averaged signal is removed. Finally, a set of peaks is obtained for each tracing. Thus, replacing the original signals by a set of selected features. As shown in the diagram, this sequence of processes is iterated over each tracing. These sets of peaks are stored in an intermediate file to be processed by operations on the right side of the diagram. The right side of this flow chart loops over all samples. First, for each sample, the sets of peak amplitudes are quantized. Next, the peak amplitudes are standardized by rank normalization. These quantized amplitudes are then converted into a binary representation. The next step of bit filtering is necessary in order to reduce noise. At this stage of processing, the data corresponding to each mass spectrometry tracing is represented as an individual binary sequence. Finally, binary sequences for each experimental condition for a given patient are concatenated, forming a binary fingerprint accurately representing the data for a patient. These binary fingerprints form the input for pattern discovery.
Figure 2
Figure 2
Examples of raw mass spectrometry tracings of patients in the two clinical categories under study. Panel A describes the mass spectrometry tracing of the amniotic fluid of a patient with an episode of premature labor without inflammation who delivered at term. Panel B describes a similar tracing in a patient with premature labor with intra-amniotic infection/inflammation. Both tracings were generated using a CM10 (cationic chip), CHCA energy absorbing matrix at a lower laser intensity. Each panel displays two tracings, one for each of the duplicated spots (one tracing in red and one tracing in blue). Each sample of amniotic fluid was run in duplicate. Note first that the mass spectrometry profile of the same fluid is very similar, suggesting a high degree of reproducibility in both clinical categories (patients with preterm labor/delivery with intra-amniotic infection/inflammation and preterm labor without intra-amniotic infection/inflammation who deliver at term). There are striking differences in the mass spectrometry profiles between the two clinical conditions. A large number of high-amplitude peaks are apparent in the tracing shown in panel B for the patient with preterm labor/delivery, with intra-amniotic infection/inflammation being absent in panel A. These high-amplitude peaks correspond to proteins present in patients with preterm labor/delivery with intra-amniotic infection/inflammation, while such proteins are either absent or in very low concentrations in patients with preterm labor without intra-amniotic infection/inflammation who deliver at term.
Figure 2
Figure 2
Examples of raw mass spectrometry tracings of patients in the two clinical categories under study. Panel A describes the mass spectrometry tracing of the amniotic fluid of a patient with an episode of premature labor without inflammation who delivered at term. Panel B describes a similar tracing in a patient with premature labor with intra-amniotic infection/inflammation. Both tracings were generated using a CM10 (cationic chip), CHCA energy absorbing matrix at a lower laser intensity. Each panel displays two tracings, one for each of the duplicated spots (one tracing in red and one tracing in blue). Each sample of amniotic fluid was run in duplicate. Note first that the mass spectrometry profile of the same fluid is very similar, suggesting a high degree of reproducibility in both clinical categories (patients with preterm labor/delivery with intra-amniotic infection/inflammation and preterm labor without intra-amniotic infection/inflammation who deliver at term). There are striking differences in the mass spectrometry profiles between the two clinical conditions. A large number of high-amplitude peaks are apparent in the tracing shown in panel B for the patient with preterm labor/delivery, with intra-amniotic infection/inflammation being absent in panel A. These high-amplitude peaks correspond to proteins present in patients with preterm labor/delivery with intra-amniotic infection/inflammation, while such proteins are either absent or in very low concentrations in patients with preterm labor without intra-amniotic infection/inflammation who deliver at term.
Figure 3
Figure 3
Flowchart for the training/testing/validation. This diagram illustrates the cross-validation methodology employed in our analysis. First, data for all 119 patients were randomly divided into training/testing and validation samples. The training/testing sample consists of data for 88 patients: 44 with preterm labor/delivery with intra-amniotic infection/inflammation and 44 with preterm labor with term delivery. The validation set encompasses the remaining 31 patients: 16 with preterm labor/delivery with intra-amniotic infection/inflammation and 15 with preterm labor with term delivery. Data from the training/testing set follow the processing indicated on the left side of this diagram. The dashed box indicates the bootstrapping procedure of 100 repeated random draws in which 58 samples where selected for training data and 30 for testing data. Training and testing data sets were “balanced,” with the training set containing 29 patients of each class and the testing set containing 15 of each class. Within one of these random draws, the classification of the training subset was available to the algorithms, while that of the test data were withheld (i.e., “blinded”). Encoding, as described in Figure 1, was carried out on the training and testing data resulting in binary fingerprints. Pattern discovery was performed on the training data to obtain sets of patterns for each of the two classes of data (preterm labor/delivery with intra-amniotic infection/inflammation and preterm labor with term delivery). These patterns were ranked as to their relative information content with respect to the two clinical classes. The patterns from both classes were matched against each test instance in order to compute a score and classification for the test instance. Thus, the result of a single random draw was a set of classifications; one for each patient in the test sample for that draw. An entire run of 100 random draws resulted in a hypothesized predictive model, implicitly defined in terms of the encoding parameters for that run. After several runs were performed on the training/testing data, the one resulting in the best overall classification accuracy was selected for prediction of the validation data set, as indicated on the right side of this diagram.
Figure 4
Figure 4
ROC curves illustrating the relationship between sensitivity (vertical axis) and false-positive rate (1-specificity) in the horizontal axis. The ROC curve constructed with open diamonds is calculated using the average of over 100 random draws of the test scores received by each patient in the training/testing data set. The ROC curve constructed with squares is calculated from the scores obtained with the patients in the validation set. The filled symbols (squares and diamonds) represent the sensitivity/specificity point obtained by using 0 as the score cutoff for classification. Sensitivity and specificity are indicated in Table VI.
Figure 5
Figure 5
Results of amniotic fluid analysis (amniotic fluid white blood cell count (WBC), IL-6 concentration) plotted versus pattern-based score, which is derived from proteomic analysis of amniotic fluid, as described in the Material and Methods section. The horizontal axis displays the rank of the pattern-based score. The lowest score is displayed on the left, and the highest score is displayed on the right. A negative value (to the left of 0) corresponds to patients whose classification, according to proteomic analysis of amniotic fluid, is predicted to be in the class of those who have preterm labor who subsequently deliver at term. A positive value (to the right of 0) corresponds to patients whose predicted classification is preterm labor/delivery with intra-amniotic infection/inflammation. The open boxes represent patients who have clinical evidence of preterm labor/delivery with intra-amniotic infection/inflammation (this diagnosis was based on results of amniotic fluid analysis). The filled circles represent patients with an episode of preterm labor who delivered at term. There is a strong correlation between the ranked pattern score and the amniotic fluid WBC count (lower panel) and IL-6 concentration (upper panel). These results indicate that low scores (derived from proteomic analysis of amniotic fluid) are generally associated with both a low concentration of IL-6 in amniotic fluid and a low WBC count. Importantly, misclassified patients who are identified with empty boxes to the left of 0 had very low concentrations of IL-6 and/or amniotic fluid WBC count. This suggests that misclassification based on proteomic analysis occurred in patients with the mildest forms of intra-amniotic inflammation. Please note that this figure is based on all 119 patients, including the 88 in the training/testing data set and the 31 in the validation data set.
Figure 6
Figure 6
Experimental data in heat graph format. Spectra have been detrended and resampled as described in the text. Colors indicate relative intensity of mass spectrometry signals (blue colors are low intensity, followed by greens, then reds and, finally, whites for maximum intensity). Each of the eight panels represents data collected with different experimental conditions which are indicated on the right side of the figure (lo/hi laser power, CHCA or SPA EAM, and H50 or CM10 chromatographic chip), and on each panel the preterm labor/delivery with intra-amniotic infection/inflammation patients are collected together below the preterm labor with term delivery patients. The m/z scale is logarithmic. The triangles underneath each panel indicate the location of features that are informative in discriminating the two patient groups. The filled triangles show stronger features identified in the first iteration of pattern discovery, while the open triangles indicate weaker but still informative features identified in the second iteration.
Figure 7
Figure 7
Clustering of instances based on the “pattern” (i.e. the 69 features identified as described in the text corresponding to 39 distinct masses). The matrix has 119 rows (patients) by 69 columns. The spectral values corresponding to the binary features were retrieved from the spectra and rank normalized (as described in the text), such that the maximum value among the 119 × 9 values was 1.0 and the minimum value was 0.0. The color legend for the matrix is in the lower right. The dendrogram of patients (on the left side) is colored by clinical class (red = preterm labor/delivery with IAI, green = preterm labor with term delivery). The dendrogram of features (on the top) is colored by the m/z of the parent ion of the feature, with a color legend in the upper right.

Similar articles

Cited by

References

    1. Hack M, Fanaroff AA. Outcomes of extremely immature infants--a perinatal dilemma. N.Engl.J Med. 1993;329:1649–1650. - PubMed
    1. Dammann O, Leviton A, Gappa M, Dammann CE. Lung and brain damage in preterm newborns, and their association with gestational age, prematurity subgroup, infection/inflammation and long term outcome. BJOG. 2005;112(Suppl 1):4–9. - PubMed
    1. Leavitt RP, Green NS, Katz M. Current and future directions of research into prematurity: report of the symposium on prematurity held on 21-22 November 2005. Pediatr.Res. 2006;60:777–780. - PubMed
    1. Callaghan WM, MacDorman MF, Rasmussen SA, Qin C, Lackritz EM. The contribution of preterm birth to infant mortality rates in the United States. Pediatrics. 2006;118:1566–1573. - PubMed
    1. Moutquin JM. Classification and heterogeneity of preterm birth. BJOG. 2003;110(Suppl 20):30–33. - PubMed

Publication types