. 2008 Jun 20:9:289.
doi: 10.1186/1471-2105-9-289.

Stability of gene contributions and identification of outliers in multivariate analysis of microarray data

Affiliations

Stability of gene contributions and identification of outliers in multivariate analysis of microarray data

Florent Baty et al. BMC Bioinformatics. .

Abstract

Background: Multivariate ordination methods are powerful tools for the exploration of complex data structures present in microarray data. These methods have several advantages compared to common gene-by-gene approaches. However, due to their exploratory nature, multivariate ordination methods do not allow direct statistical testing of the stability of genes.

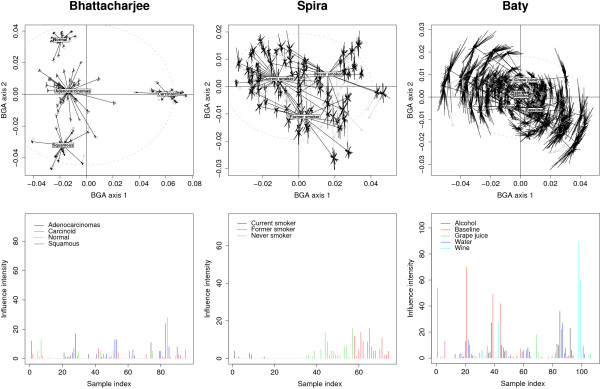
Results: In this study, we developed a computationally efficient algorithm for: i) the assessment of the significance of gene contributions and ii) the identification of sample outliers in multivariate analysis of microarray data. The approach is based on the use of resampling methods including bootstrapping and jackknifing. A statistical package of R functions was developed. This package includes tools for both inferring the statistical significance of gene contributions and identifying outliers among samples.

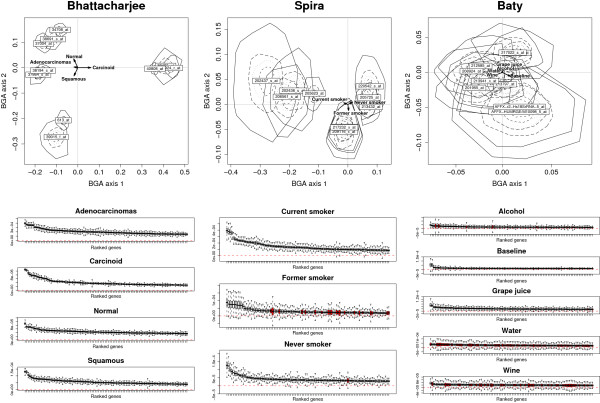
Conclusion: The methodology was successfully applied to three published data sets with varying levels of signal intensities. Its relevance was compared with alternative methods. Overall, it proved to be particularly effective for the evaluation of the stability of microarray data.


Figures

Figure 1
Figure 1
Assessment of gene contributions by orthogonal projections. The contribution of gene j toward the three classes of samples is measured by the distance α0 from the center of the BGA axes to the orthogonal projections onto the vectors of class centroids.
Figure 2
Figure 2
Stability of gene contributions using bootstrapping. Uncertainty plots in the upper panels display for each data set the coordinates of the 10 most discriminating genes after partial bootstrap (500 repetitions) in the first two axes of BGA. Convex hulls containing 25%, 50%, 75% and 100% of the points are used to represent the spread of gene coordinates. The directions of class centroids are represented by arrows. In the lower panels, sensitivity boxplots show the distributions of gene contributions. Genes are ranked from left to right according to their discriminating power. The zero threshold is depicted as a dashed line. Gene distributions where more than 5% of values are below 0, are represented as plain boxplots.
Figure 3
Figure 3
Detection of influential observations and outliers by jackknifing. Stability plots in the upper panels show the shifts of sample coordinates induced by jackknifing in the first two axes of BGA. The dashed ellipse delineate 2 standard deviations of the sample coordinates on the displayed axes. Barplots in the lower panels show how many times samples were declared as significantly influential.

References

    1. Alter O, Brown PO, Botstein D. Singular value decomposition for genome-wide expression data processing and modeling. Proc Natl Acad Sci USA. 2000;97:10101–10106. - PMC - PubMed
    1. Fellenberg K, Hauser NC, Brors B, Neutzner A, Hoheisel JD, Vingron M. Correspondence analysis applied to microarray data. Proc Natl Acad Sci USA. 2001;98:10781–10786. - PMC - PubMed
    1. Culhane AC, Perrière G, Considine EC, Cotter TG, Higgins DG. Between-group analysis of microarray data. Bioinformatics. 2002;18:1600–1608. - PubMed
    1. Baty F, Facompré M, Wiegand J, Schwager J, Brutsche MH. Analysis with respect to instrumental variables for the exploration of microarray data structures. BMC Bioinformatics. 2006;7:422. - PMC - PubMed
    1. Jackson DA. Stopping rules in principal components analysis: a comparison of heuristical and statistical approaches. Ecology. 1993;74:2204–2214.

Publication types

MeSH terms

LinkOut - more resources