. 2008;9(6):R101.
doi: 10.1186/gb-2008-9-6-r101. Epub 2008 Jun 20.

Modified cell cycle status in a mouse model of altered neuronal vulnerability (slow Wallerian degeneration; Wlds)

Affiliations

Modified cell cycle status in a mouse model of altered neuronal vulnerability (slow Wallerian degeneration; Wlds)

Thomas M Wishart et al. Genome Biol. 2008.

Abstract

Background: Altered neuronal vulnerability underlies many diseases of the human nervous system, resulting in degeneration and loss of neurons. The neuroprotective slow Wallerian degeneration (Wlds) mutation delays degeneration in axonal and synaptic compartments of neurons following a wide range of traumatic and disease-inducing stimuli, providing a powerful experimental tool with which to investigate modulation of neuronal vulnerability. Although the mechanisms through which Wlds confers neuroprotection remain unclear, a diverse range of downstream modifications, incorporating several genes/pathways, have been implicated. These include the following: elevated nicotinamide adenine dinucleotide (NAD) levels associated with nicotinamide mononucleotide adenylyltransferase 1 (Nmnat1; a part of the chimeric Wlds gene); altered mRNA expression levels of genes such as pituitary tumor transforming gene 1 (Pttg1); changes in the location/activity of the ubiquitin-proteasome machinery via binding to valosin-containing protein (VCP/p97); and modified synaptic expression of proteins such as ubiquitin-activating enzyme E1 (Ube1).

Results: Wlds expression in mouse cerebellum and HEK293 cells induced robust increases in a broad spectrum of cell cycle-related genes. Both NAD-dependent and Pttg1-dependent pathways were responsible for mediating different subsets of these alterations, also incorporating changes in VCP/p97 localization and Ube1 expression. Cell proliferation rates were not modified by Wlds, suggesting that later mitotic phases of the cell cycle remained unaltered. We also demonstrate that Wlds concurrently altered endogenous cell stress pathways.

Conclusion: We report a novel cellular phenotype in cells with altered neuronal vulnerability. We show that previous reports of diverse changes occurring downstream from Wlds expression converge upon modifications in cell cycle status. These data suggest a strong correlation between modified cell cycle pathways and altered vulnerability of axonal and synaptic compartments in postmitotic, terminally differentiated neurons.


Figures

Figure 1
Figure 1
Up-regulation of cell cycle genes in terminally differentiated neurons from Wlds mouse cerebellum in vivo. Three-dimensional bar chart taken from SuperArray analysis software (cell cycle specific SuperArray; see Materials and methods) showing fold difference in expression levels for 84 cell cycle related genes, comparing wild-type cerebellum (control sample) with Wlds cerebellum (test sample). Individual genes with greater than twofold expression change can be found in Table 1.
Figure 2
Figure 2
Quantitative fluorescent Western blots validate changes in cell cycle proteins in Wlds cerebellum in vivo. Bar chart showing percentage change in protein expression (mean ± standard error of the mean; n ≥ 3 for all proteins) in Wlds cerebellum compared with wild-type. As expected, Wlds protein expression was highly upregulated (left bar). The second portion of the graph shows increases in both pituitary tumor transforming gene 1 (Pttg1) and ubiquitin-activating enzyme E1 (Ube1) proteins in Wlds mice, both of which have previously been implicated in the Wlds neuroprotective phenotype [22,31]. The third portion of the graph shows validation for two genes highlighted on the SuperArray analysis as being upregulated by more than twofold. The final portion of the graph shows similar increases in cell cycle proteins not included on the SuperArray plate, showing that increased expression of cell cycle proteins is not restricted to those included on the SuperArray. Statistical tests were carried out comparing raw expression data from wild-type mice with those from Wlds mice. **P < 0.01, P < 0.001 by unpaired t-test (two-tailed). ns, not significant.
Figure 3
Figure 3
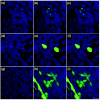
Immunocytochemistry confirms increased nuclear expression of Ube1 in Wlds mouse cerebellum. Confocal micrographs of cerebellar granule cells from (a-c) Wlds and (d-f) wild-type mice. Ubiquitin-activating enzyme E1 (Ube1) is shown in green and the nuclear marker TOPRO3 is shown in blue (panels a and d show Ube1; panels b and e show TOPRO3; and panels c and f show both markers). Note how Ube1 protein appears to be more strongly expressed in the nuclei of Wlds cerebellar neurons, whereas TOPRO3 and cytoplasmic levels of Ube1 appear unchanged. (g-i) Scatter plots (line indicates mean) of fluorescence intensity (see Materials and methods) of nuclear Ube1 (panel g), nuclear TOPRO3 (panel h), and cytoplasmic Ube1 (panel i). Only nuclear Ube1 was significantly increased in intensity in Wlds neurons (P < 0.001; by unpaired, two-tailed t-test). Scale bar 20 μm.
Figure 4
Figure 4
Quantitative fluorescent Western blots validate changes in cell cycle proteins in Wlds-expressing HEK293 cells in vitro. Bar chart showing percentage change in protein expression (mean ± standard error of the mean; n ≥ 3 for all proteins) in Wlds-transfected HEK293 cells compared with enhanced green fluorescent protein (eGFP)-transfected control cells. As expected, Wlds protein expression was highly upregulated (left bar). The second portion of the graph shows increases in both pituitary tumor transforming gene 1 (Pttg1) and ubiquitin-activating enzyme E1 (Ube1) proteins following Wlds transfection, both of which were previously implicated in the Wlds neuroprotective phenotype [22,31]. The third portion of the graph shows validation for two genes highlighted on the SuperArray analysis as being upregulated by more than twofold. The final portion of the graph shows similar increases in cell cycle proteins not included on the SuperArray plate, showing that increased expression of cell cycle proteins is not restricted to those included on the SuperArray. All genes were significantly increased in expression levels in Wlds-transfected cells compared with control cells. **P < 0.01, ***P < 0.001 by unpaired t-test (two-tailed).
Figure 5
Figure 5
Increased expression of the cell cycle marker phosphohistone H2Ax in Wlds transfected HEK293 cells. Confocal micrographs of HEK293 cells 5 days after transfection with either an (a-f) enhanced green fluorescent protein (eGFP)-Wlds construct or (g-i) a eGFP-only control construct. Immunocytochemical labeling of phosphohistone H2Ax is shown in red, the nuclear marker TOPRO3 is shown in blue, and constructs are expressing in green (panels a, d and g show H2Ax and TOPRO3; panels b, e and h show construct and TOPRO3; and panels c, f and i show all three markers). Note how phosphohistone H2Ax protein can only be seen in nuclear puncta where Wlds is being expressed. Note that not all cells have transfected with construct, and non-Wlds expressing cells identifiable by their TOPRO3 labeled nuclei do not have corresponding H2Ax puncta. H2Ax puncta were found in all Wlds-expressing cells, regardless of the nuclear distribution of Wlds (panels a to c show Wlds in nuclear inclusions; panels d to f show Wlds expressed in a strong diffuse manner throughout the nucleus). Scale bar 10 μm.
Figure 6
Figure 6
Wlds does not influence late stages of cell cycle regulating cell proliferation in NT2 cells. Bar charts showing relative proliferation rates of NT2 cells transfected with either a control vector (black bars) or a Wlds vector (white bars) at low, medium, and high concentrations. (a) Panel a shows no difference in proliferation at 48 hours after transfection using an MTT (3-[4,5-dimethylthiazolyl-2]-2,5-diphenyltetrazolium bromide) assay. (b) Panel b similarly shows no difference in proliferation at 72 hours after transfection using an MTT assay. (c) Panel c shows no difference in proliferation at 48 hours after transfection using a tritiated thymidine incorporation assay (all comparisons P > 0.05; analysis fo variance with Tukey's post hoc test).
Figure 7
Figure 7
Pharmacological inhibition of cell cycle progression (flavopiridol) versus Wlds: opposing changes in cell cycle proteins. (a) Bar chart showing protein expression assayed by quantitative fluorescent western blots in HEK293 cells transfected with Wlds (black bars) or treated with exogenous flavopiridol (10 μmol/l; cell cycle inhibitor). Whereas Wlds induced increases in all cell cycle proteins, flavopiridol treatment led to decreased expression of the majority of proteins examined. (b) Representative Western blots showing pituitary tumor transforming gene 1 (Pttg1) protein levels in HEK293 cells comparing control versus Wlds transfected cells (top panel) and control versus flavopiridol treated cells (bottom panel). Note how Pttg1 protein levels are increased by Wlds expression and decreased by flavopiridol treatment.
Figure 8
Figure 8
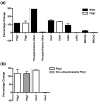
Over-expression of ubiquitinatable Pttg1 is required to elicit changes in the cell cycle protein Ube1. Presented are quantitative fluorescent Western blots of HEK293 cells (n = 3 for all proteins). (a) Changes in four cell cycle proteins known to be modified by Wlds after transfection with either a Wlds construct (black bars) or a pituitary tumor transforming gene 1 (Pttg1) over-expression construct (white bars). The first portion of the graph shows normalized Pttg1 levels accounting for differences in transfection efficiency. Note how Pttg1 induced the same level of increase in ubiquitin-activating enzyme E1 (Ube1) expression as Wlds but had no effect on the three other proteins. (b) changes in Ube1 can only be induced by a ubiquitinatable form of Pttg1, because transfection with a non-ubiquitinatable form of Pttg1 (gray bars) could not elicit any changes in Ube1 expression (right portion of graph).
Figure 9
Figure 9
Upregulation of cell cycle genes in HEK293 cells treated with 1 mmol/l exogenous NAD. Three-dimensional bar chart taken from SuperArray analysis software (cell cycle SuperArray; see Materials and methods) showing fold difference in expression levels for 84 cell cycle related genes comparing vehicle treated HEK293 cells (control sample) with nicotinamide adenine dinucleotide (NAD) treated HEK293 cells (test sample). Individual genes with a greater than twofold expression change can be found in Table 2. NAD, nicotinamide adenine dinucleotide.
Figure 10
Figure 10
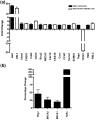
NAD-induced changes in cell cycle genes mimic Wlds-induced changes. (a) Bar chart showing greater than twofold changes in cell cycle genes from SuperArray experiments on Wlds cerebellum (black bars; see Table 1) compared with nicotinamide adenine dinucleotide (NAD) treated HEK293 cells (white bars; see Table 2). Of the nine genes examined, eight responded similarly in both experimental groups. (b) Bar chart showing percentage difference in protein expression in NSC34 cells treated with 1 mmol/l exogenous NAD as compared with control-treated cells.
Figure 11
Figure 11
Increased nuclear expression of cell cycle marker VCP corresponding with Wlds expression in mouse cerebellum. Confocal micrographs of cerebellar granule cells from (a-c) Wlds and (d-f) wild-type mice. Valosin-containing protein (VCP) is shown in green, the nuclear marker TOPRO3 is shown in blue, and Wlds protein in red (panels a and d show VCP and TOPRO3; panels b and e show Wlds and TOPRO3; and panels c and f show all three markers). Note how VCP protein can be seen in nuclear puncta with high frequency where Wlds is being expressed (arrows in panels a and c show four out of nine examples in this field of view). The majority of Wlds puncta coincided with VCP puncta. Nuclear puncta of VCP were rarely observed in wild-type cerebellar granule cells. As expected, VCP was detectable as diffuse staining in the cytoplasm of neurons in both strains of mice. Scale bar = 20 μm.
Figure 12
Figure 12
Widespread alterations in cell stress genes in uninjured/untreated Wlds mouse cerebellum in vivo. Three-dimensional bar chart taken from SuperArray analysis software (cell stress SuperArray; see Materials and methods) showing fold difference in expression levels for 84 cell stress related genes comparing wild-type cerebellum (control sample) with Wlds cerebellum (test sample). Individual genes with a greater than twofold expression change can be found in Table 3.
Figure 13
Figure 13
Increased nuclear expression of cell stress marker STI1 corresponding with Wlds expression in HEK293 cells. Confocal micrographs of HEK293 cells transfected with either an (a-f) enhanced green fluorescent protein (eGFP)-Wlds construct or an (g-i) eGFP alone control construct. Stress induced phosphoprotein 1 (STI1) is shown in red, the nuclear marker TOPRO3 is shown in blue, and Wlds protein in green (panels a, d and g show STI1 and TOPRO3; panels b, e and h show construct and TOPRO3; and c, f and i show all three markers). Note how STI1 protein can be seen in nuclear puncta with high frequency where Wlds is being expressed, but was never observed in non-Wlds-expressing cells. The majority of Wlds puncta coincided with STI1 puncta. Nuclear puncta of STI1 were never observed in eGFP transfected control cells (panels g-i). Scale bar = 10 μm.

References

    1. Gillingwater TH, Ribchester RR. Compartmental neurodegeneration and synaptic plasticity in the Wlds mutant mouse. J Physiol. 2001;534:627–639. doi: 10.1111/j.1469-7793.2001.00627.x. - DOI - PMC - PubMed
    1. Raff MC, Whitmore AV, Finn JT. Axonal destruction and neurodegeneration. Science. 2002;296:868–871. doi: 10.1126/science.1068613. - DOI - PubMed
    1. Coleman MP, Perry VH. Axon pathology in neurological disease: a neglected therapeutic target. Trends Neurosci. 2002;25:532–537. doi: 10.1016/S0166-2236(02)02255-5. - DOI - PubMed
    1. Wishart TM, Parson SH, Gillingwater TH. Synaptic vulnerability in neurodegenerative disease. J Neuropathol Exp Neurol. 2006;65:733–739. doi: 10.1097/01.jnen.0000228202.35163.c4. - DOI - PubMed
    1. Lunn ER, Perry VH, Brown MC, Rosen H, Gordon S. Absence of Wallerian degeneration does not hinder regeneration in peripheral nerve. Eur J Neurosci. 1989;1:27–33. doi: 10.1111/j.1460-9568.1989.tb00771.x. - DOI - PubMed

Publication types