. 2008 Aug;49(2):262-73.
doi: 10.1016/j.jhep.2008.04.023. Epub 2008 Jun 4.

Prevention of alcoholic fatty liver and mitochondrial dysfunction in the rat by long-chain polyunsaturated fatty acids

Affiliations

Prevention of alcoholic fatty liver and mitochondrial dysfunction in the rat by long-chain polyunsaturated fatty acids

Byoung-Joon Song et al. J Hepatol. 2008 Aug.

Abstract

Background/aims: We reported that reduced dietary intake of polyunsaturated fatty acids (PUFA) such as arachidonic (AA,20:4n6,omega-6) and docosahexaenoic (DHA,22:6n3,omega-3) acids led to alcohol-induced fatty liver and fibrosis. This study was aimed at studying the mechanisms by which a DHA/AA-supplemented diet prevents alcohol-induced fatty liver.

Methods: Male Long-Evans rats were fed an ethanol or control liquid-diet with or without DHA/AA for 9 weeks. Plasma transaminase levels, liver histology, oxidative/nitrosative stress markers, and activities of oxidatively-modified mitochondrial proteins were evaluated.

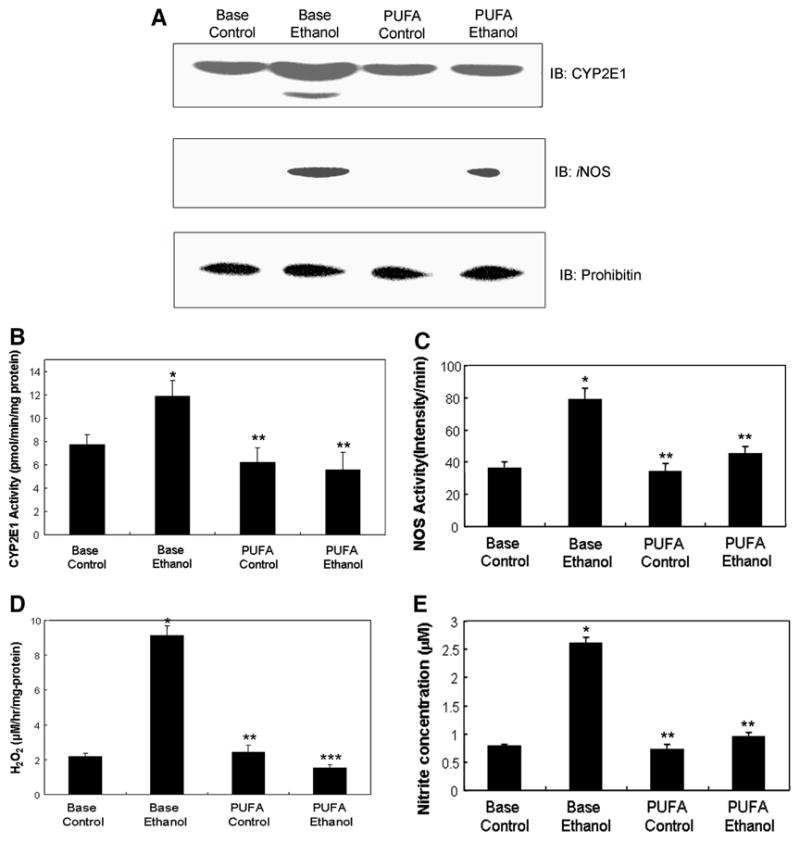
Results: Chronic alcohol administration increased the degree of fatty liver but fatty liver decreased significantly in rats fed the alcohol-DHA/AA-supplemented diet. Alcohol exposure increased oxidative/nitrosative stress with elevated levels of ethanol-inducible CYP2E1, nitric oxide synthase, nitrite and mitochondrial hydrogen peroxide. However, these increments were normalized in rats fed the alcohol-DHA/AA-supplemented diet. The number of oxidatively-modified mitochondrial proteins was markedly increased following alcohol exposure but significantly reduced in rats fed the alcohol-DHA/AA-supplemented diet. The suppressed activities of mitochondrial aldehyde dehydrogenase, ATP synthase, and 3-ketoacyl-CoA thiolase in ethanol-exposed rats were also recovered in animals fed the ethanol-DHA/AA-supplemented diet.

Conclusions: Addition of DHA/AA prevents alcohol-induced fatty liver and mitochondrial dysfunction in an animal model by protecting various mitochondrial enzymes most likely through reducing oxidative/nitrosative stress.


Figures

Fig. 1
Fig. 1
Comparision of liver histology scores of four different dietary groups. (A) photomicrographs (200 ×) after H & E staining of rat livers fed; a) BASE-Control diet, b) BASE-EtOH diet showing a high degree of hepatocellular cytoplasmic vacuolation (macrovesicular and microvesicular steatosis), c) PUFA-Control diet, and d) PUFA-EtOH diet with minimal changes. (B) Histopatology scores in four different groups were evaluated microscopically in a double-blind manner after H & E staining of liver specimens. Each bar represents the average score ± SD (n = 11–12/group). * and **, significantly different (*p < 0.03 and **p < 0.01) from the BASE-EtOH group.
Fig. 2
Fig. 2
Biochemical analysis of fat accumulation. Hepatic levels of total triglyceride (A) and cholesterol (B) in the four dietary groups, as indicated (n ≥ 8 per group) are presented. (C) Equal amounts of the hepatic cytosolic proteins (10 μg/well) from the four dietary groups were separated on 12 % SDS-PAGE, transferred to PVDF-immunobilon membranes, and subjected to imminoblot analysis (IB) by using a specific antibody to phospho-ACC (top) or β-actin (bottom). (D) The density of each band was determined by using Image J (v.1.38) software. The relative density was calculated by the ratio of the band in BASE-EtOH group which shows the smallest value. *significantly different from the BASE-Control group at p< 0.0005; **significantly different from the BASE-EtOH group at p<0.0005; *** significantly different from the BASE-Control group at p< 0.05; ****significantly different from the BASE-EtOH group at p<0.05; *****significantly different from the PUFA-Control group at p< 0.05.
Fig. 3
Fig. 3
Levels of mitochondrial CYP2E1, iNOS, nitrite concentration, NOS activity in rat livers from the four dietary groups. (A) Equal amounts of hepatic mitochondrial proteins (20 μg/well) from different groups were separated on 12 % SDS-PAGE, transferred to PVDF-immobilon membranes, and subjected to immunoblot analysis (IB) by using anti-CYP2E1, iNOS, and prohibitin antibody. (B) The activities of microsomal CYP2E1 (*, significantly different (*p < 0.025) from the BASE-Control group; **, significantly different (**p < 0.01) from the BASE-EtOH group.) and (C) mitochondrial NOS in different groups (*, significantly different (*p < 0.005) from the BASE-Control group; **, significantly different (**p < 0.005) from the BASE-EtOH group.) were determined (0.5 mg protein/assay) and compared. Mitochondrial proteins (0.5 mg protein/assay) were used to determine (D) the hydrogen peroxide production (*, significantly different (*p < 0.001) from the BASE-Control group; ** and ***, significantly different (**p < 0.0005 and ***p < 0.005) from the BASE-EtOH group.) using Amplex red dye in the presence of pyruvate (5.0 mM) and malate (2.0 mM) or (E) nitrite concentrations (*p < 0.0005) from the BASE-Control group; **, significantly different (**p < 0.00005) from the BASE-EtOH group ). Each point represents the average ± S.D. of three determinations. This figure represents a typical result from two separate experiments.
Fig. 4
Fig. 4
Comparison of oxidized mitochondrial proteins by 2D-PAGE in the four dietary groups. Oxidized mitochondrial proteins (10 mg/sample) from BASE-Control (A), BASE-EtOH (B), PUFA-Control (C), and PUFA-EtOH (D) were labeled with biotin-NM in the presence of DTT and purified with streptavidin-agarose. Purified biotin-NM labeled proteins (0.25 mg/sample) were resolved by 2D-PAGE, and silver stained. Squares are used as an internal standard for comparison of the different gels (A – D). These data represent similar results from two independent experiments. Another batch of purified biotin-NM labeled proteins were separated by 1D- PAGE and subjected to immunoblot analysis (IB) by using the specific antibody to 3-ketoacyl-CoA thiolase (E) or α-ATP synthase (F).
Fig. 5
Fig. 5
Reversible inactivation of 3-ketoacyl-CoA thiolase in alcohol-exposed groups in the absence and presence of PUFA. (A) Mitochondrial 3-ketoacyl-CoA thiolase activities in four groups treated with different diets were determined and are presented. One unit of thiolase was defined as the amount of thiolase that catalyzes the cleavage of 1 nmol acetoacetyl-CoA to acetyl-CoA/min/mg protein at room temperature. (B) Mitochondrial proteins (1 mg/sample) from the BASE-EtOH group were incubated without and with 15 mM DTT or Asc for 30 min before 3-ketoacyl-CoA thiolase activity was determined. *, significantly different (*p < 0.005) from the BASE-Control group; **, significantly different (**p < 0.01) from the BASE-EtOH group.
Fig. 6
Fig. 6
Reversible inactivation of ATP synthase in the alcohol-exposed groups with and without PUFA. (A) Mitochondrial ATP synthase activities in the four dietary groups were determined by using an ATP bioluminescence assay kit (Roche, Manheim, German) following the manufacturer’s protocol. One unit of ATP synthesis activity represents 1 nM ATP produced/min/mg protein at room temperature. (B) Mitochondrial proteins (1 mg/sample) from the 4 different groups were immunoprecipiated (IP) with anti-β-ATP synthase antibody, as described [11]. Immunoprecipitated proteins from each group were then subjected to 12 % SDS-PAGE, transferred to Immobilon membrane, and immunoblot analysis (IB) with anti-β-ATP synthase (left) or anti-3-NT antibody (right). *, significantly different (*p < 0.001) from the BASE-Control group; ** and ***, significantly different (**p < 0.0005 and ***p < 0.01) from the BASE-EtOH group.
Fig. 7
Fig. 7
Levels of malondialdehyde (MDA) and ALDH2 activity in ethanol-exposed groups with and without PUFA. (A) Levels of MDA (*, significantly different (*p < 0.005) from the BASE-Control group; ** and ***, significantly different (**p < 0.05 and ***p < 0.01) from the BASE-EtOH group.) and (B) mitochondrial ALDH2 activity (*, significantly different (*p < 0.001) from the BASE-Control group; **, significantly different (**p < 0.005) from the BASE-EtOH group.) in different groups were determined.

References

    1. Das UN. Essential fatty acids: biochemistry, physiology and pathology. Biotechnol J. 2006;1:420–439. - PubMed
    1. Schaefer EJ, Lichtenstein AH, Lamon-Fava S, McNamara JR, Schaefer MM, Rasmussen H, et al. Body weight and low-density lipoprotein cholesterol changes after consumption of a low-fat ad libitum diet. JAMA. 1995;274:1450–1455. - PubMed
    1. Salem N, Jr, Reyzer M, Karanian J. Losses of arachidonic acid in rat liver after alcohol inhalation. Lipids. 1996;31:S153–S156. - PubMed
    1. Salem N, Jr, Olsson NU. Abnormalities in essential fatty acid status in alcoholism. In: Yehuda S, Mostofsky DI, editors. Handbook of Essential Fatty Acid Biology: Biochemistry, Physiology and Behavioral Neurobiology. Totowa: Humana Press; 1997. pp. 67–87.
    1. Joly J-G, Hetu C. Effects of chronic ethanol administration in the rat: relative dependency on dietary lipids - I. Induction of hepatic drug-metabolizing enzymes in vitro. Biochem Pharmacol. 1975;24:1475–1480. - PubMed

Publication types

MeSH terms