. 2008 Jun 24;18(12):883-9.
doi: 10.1016/j.cub.2008.04.074.

Natural selection on genes that underlie human disease susceptibility

Affiliations

Natural selection on genes that underlie human disease susceptibility

Ran Blekhman et al. Curr Biol. .

Abstract

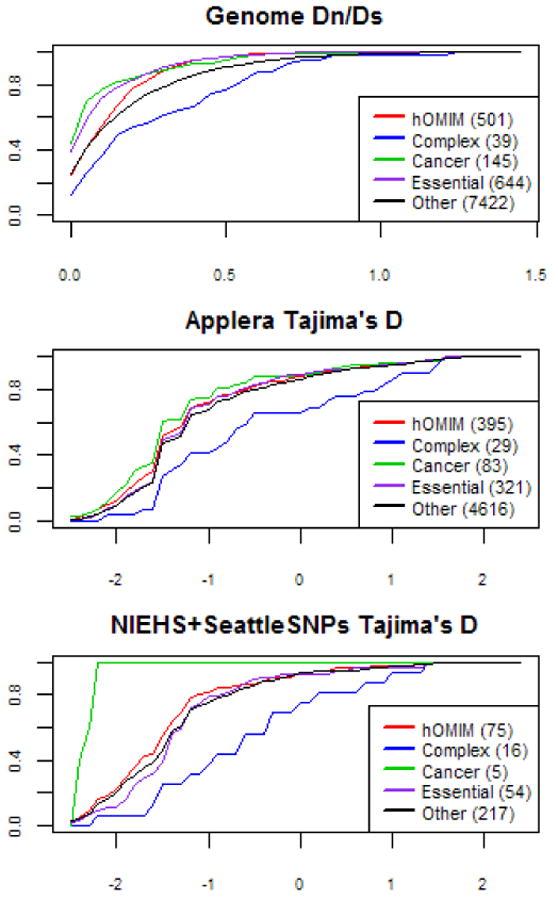
What evolutionary forces shape genes that contribute to the risk of human disease? Do similar selective pressures act on alleles that underlie simple versus complex disorders [1-3]? Answers to these questions will shed light onto the origin of human disorders (e.g., [4]) and help to predict the population frequencies of alleles that contribute to disease risk, with important implications for the efficient design of mapping studies [5-7]. As a first step toward addressing these questions, we created a hand-curated version of the Mendelian Inheritance in Man database (OMIM). We then examined selective pressures on Mendelian-disease genes, genes that contribute to complex-disease risk, and genes known to be essential in mouse by analyzing patterns of human polymorphism and of divergence between human and rhesus macaque. We found that Mendelian-disease genes appear to be under widespread purifying selection, especially when the disease mutations are dominant (rather than recessive). In contrast, the class of genes that influence complex-disease risk shows little signs of evolutionary conservation, possibly because this category includes targets of both purifying and positive selection.


Figures

Figure 1
Figure 1
Mode of inheritance and age of onset of disease phenotypes in our hand-curated version of the OMIM database. The data are in Supplementary Materials A.
Figure 2
Figure 2
Cumulative distributions of Dn/Ds (for two sets of alignments) and Tajima's D as a function of the mode of inheritance. The value of the statistic is given on the x-axis. AR refers to autosomal recessive and AD to autosomal dominant. In parenthesis are the numbers of genes in each category. The distributions of Dn/Ds for AD and AR categories are significantly different from one another, but the distributions of Tajima's D values are not (see Supplementary Table 1). Tajima's D was calculated for amino-acid variants, using the European population sample; when the African-American sample is used instead, the order of AR and AD is reversed but again the distributions are not significantly different (not shown).
Figure 3
Figure 3
Estimate of two parameters, ω and γ, obtained from pooled polymorphism and divergence data in different categories of genes, including those in hOMIM, those associated with complex disease susceptibility (“complex”), with cancer (“cancer”), for which knock-outs are inviable or sterile in mice (“essential”) and genes in none of the above categories (“other”). Genes in hOMIM are further broken down into two categories, depending on whether mutations cause dominant (“AD”) or recessive (“AR”) disease phenotypes. Shown are the mean and the standard deviation of the posterior distribution estimate for each parameter. The parameter ω=log(θRS) can be thought of as the fraction of amino-acid mutations that contribute to polymorphism i.e., are neutral or nearly neutral (θR is the effective mutation rate at replacement sites and θS at synonymous sites), while γ is the selection coefficient acting on mutations in a category of genes. The estimates are obtained by assuming one selection coefficient γ for all mutations within a category; given this unrealistic assumption, the value of the γ estimate is less informative than the ordering for the different categories (see SOM for details). Summaries of the pooled polymorphism and divergence data for genes in each category are given in the last panel (see Methods for details). We note that γ can also be thought of not as a parameter estimate but as a summary of the pooled tables for each category, thereby capturing similar information to the odds ratio (shown below).
Figure 3
Figure 3
Estimate of two parameters, ω and γ, obtained from pooled polymorphism and divergence data in different categories of genes, including those in hOMIM, those associated with complex disease susceptibility (“complex”), with cancer (“cancer”), for which knock-outs are inviable or sterile in mice (“essential”) and genes in none of the above categories (“other”). Genes in hOMIM are further broken down into two categories, depending on whether mutations cause dominant (“AD”) or recessive (“AR”) disease phenotypes. Shown are the mean and the standard deviation of the posterior distribution estimate for each parameter. The parameter ω=log(θRS) can be thought of as the fraction of amino-acid mutations that contribute to polymorphism i.e., are neutral or nearly neutral (θR is the effective mutation rate at replacement sites and θS at synonymous sites), while γ is the selection coefficient acting on mutations in a category of genes. The estimates are obtained by assuming one selection coefficient γ for all mutations within a category; given this unrealistic assumption, the value of the γ estimate is less informative than the ordering for the different categories (see SOM for details). Summaries of the pooled polymorphism and divergence data for genes in each category are given in the last panel (see Methods for details). We note that γ can also be thought of not as a parameter estimate but as a summary of the pooled tables for each category, thereby capturing similar information to the odds ratio (shown below).
Figure 4
Figure 4
Cumulative distributions of Dn/Ds and Tajima's D for hOMIM, genes associated with complex disease susceptibility (“complex”), in which mutations are associated with cancer (“cancer”), for which knock-outs are inviable or sterile in mice (“essential”) and genes in none of the above categories (“other”). For other details, see legend of Figure 2. The distributions of Dn/Ds are significantly different in all pairwise comparisons (at the 5% level), other than in the comparisons of “essential” genes vs. “cancer” genes and of “other” genes vs. “complex” disease, where significance is marginal (see Supplementary Table 1). The distributions of Tajima's D values in the larger Applera dataset (shown here for the European samples) are significantly different for genes associated with complex diseases vs. either hOMIM or generic genes at the 5% level (see Supplementary Table 1); all other pairwise comparisons are also significant, other than cancer vs. hOMIM, hOMIM vs. essential, and other vs. essential.

References

    1. Zwick ME, Cutler DJ, Chakravarti A. Patterns of genetic variation in Mendelian and complex traits. Annu Rev Genomics Hum Genet. 2000;1:387–407. - PubMed
    1. Lohmueller KE, Mauney MM, Reich D, Braverman JM. Variants associated with common disease are not unusually differentiated in frequency across populations. Am J Hum Genet. 2006;78:130–136. - PMC - PubMed
    1. Di Rienzo A. Population genetics models of common diseases. Curr Opin Genet Dev. 2006;16:630–636. - PubMed
    1. Keller MC, Miller G. Resolving the paradox of common, harmful, heritable mental disorders: which evolutionary genetic models work best? Behav Brain Sci. 2006;29:385–404. discussion 405-352. - PubMed
    1. Pritchard JK, Cox NJ. The allelic architecture of human disease genes: common disease-common variant…or not? Hum Mol Genet. 2002;11:2417–2423. - PubMed

Publication types