

Precise registration of gene expression boundaries by a repressive morphogen in Drosophila
- PMID: 18571415
- PMCID: PMC2481289
- DOI: 10.1016/j.cub.2008.05.050
Precise registration of gene expression boundaries by a repressive morphogen in Drosophila
Abstract
Background: Morphogen gradients are thought to create concentration thresholds that differentially position the expression boundaries of multiple target genes. Despite intensive study, it is still unclear how the concentration profiles within gradients are spatially related to the critical patterning thresholds they generate.
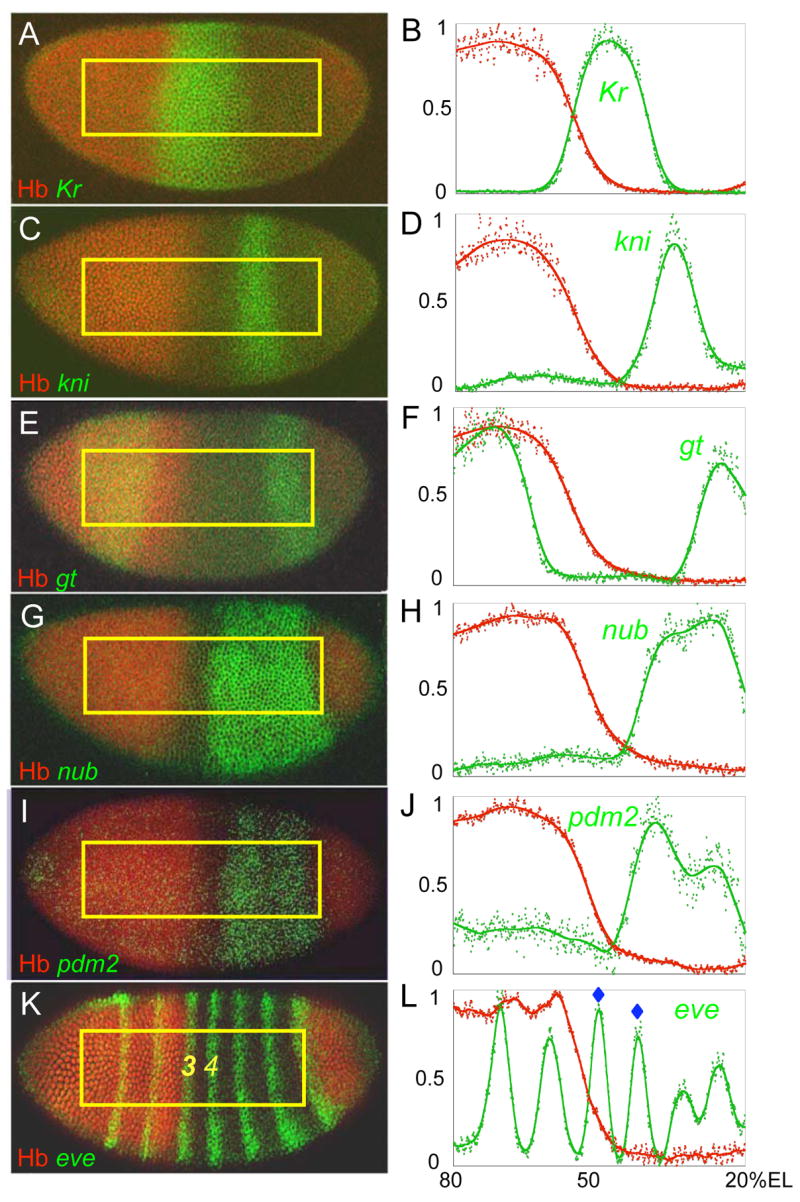
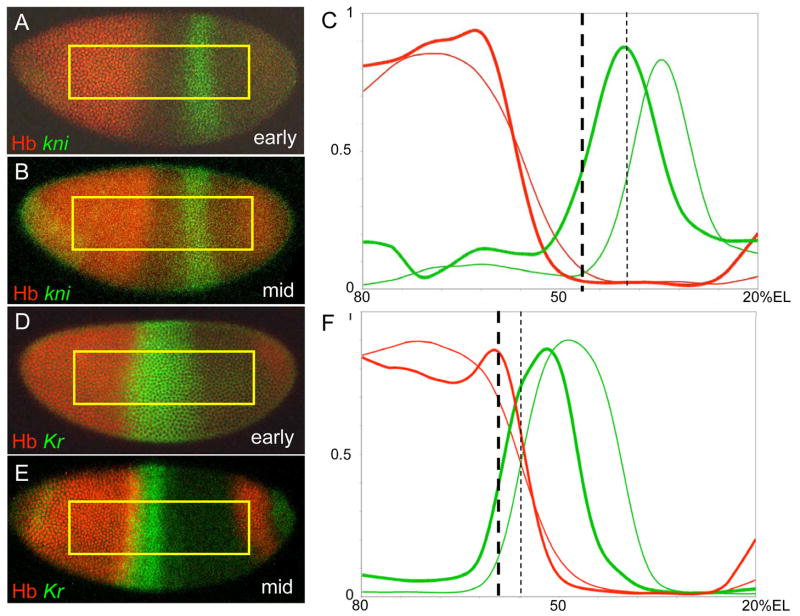
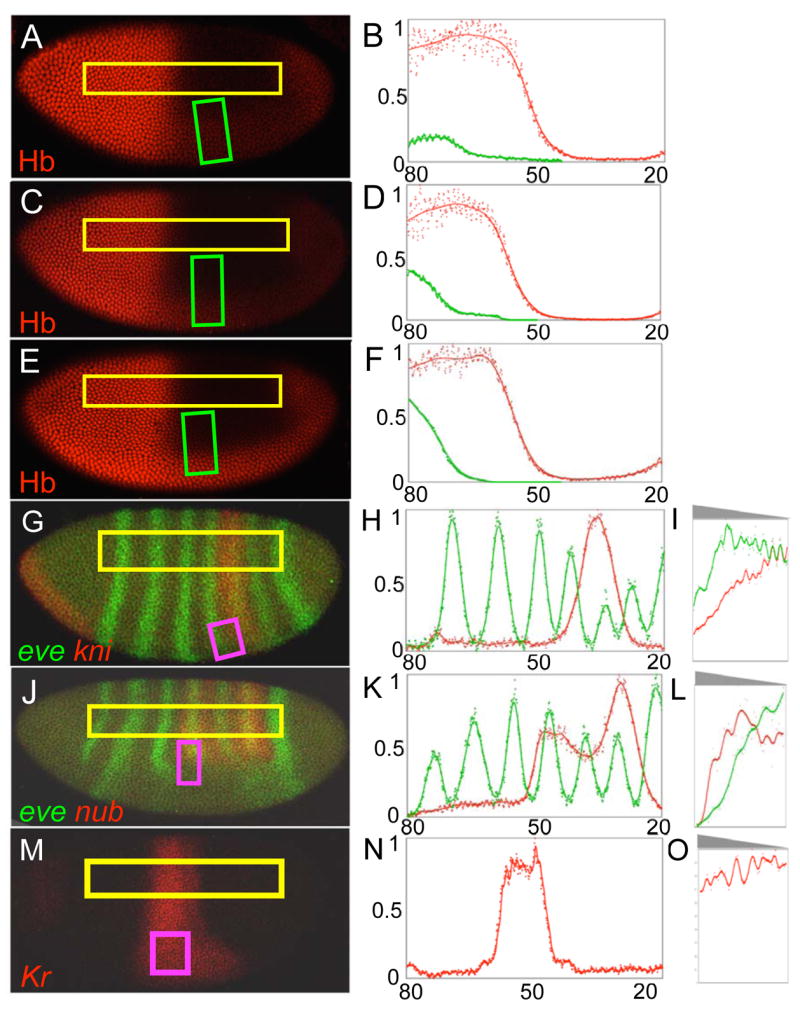
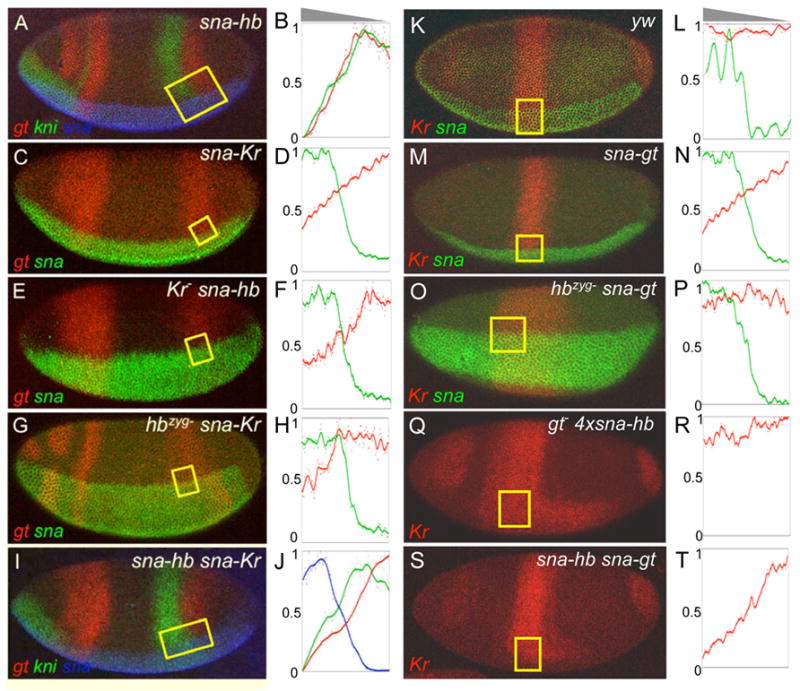
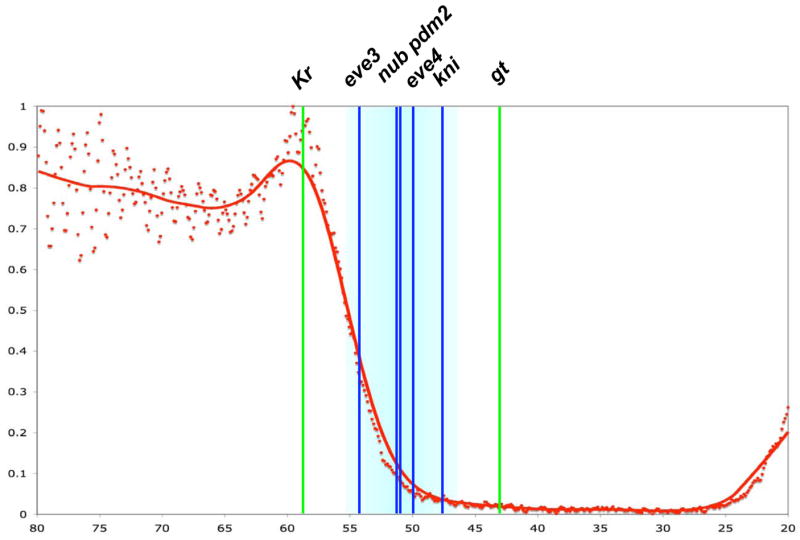
Results: Here we use a combination of quantitative measurements and ectopic-misexpression experiments to examine the transcriptional-repression activities of the Hunchback (Hb) protein gradient in Drosophila embryos. Our results define five expression boundaries that are set primarily by differences in Hb concentration and two boundaries that are set by combinatorial mechanisms involving Hb and at least one other repressor.
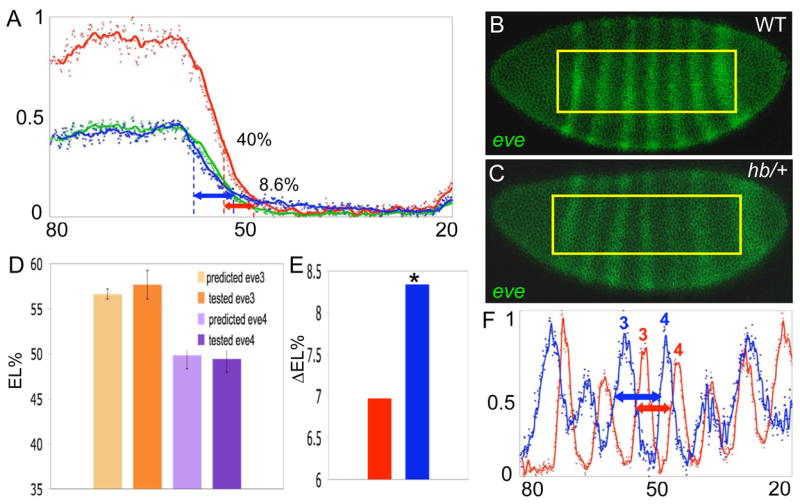
Conclusions: Hb functions as a repressive morphogen, but only within a specific range of concentrations ( approximately 40% to approximately 4.4% of maximum Hb concentration), within which there are at least four distinct concentration thresholds. The lower limit of the range reflects a position where the slope of the gradient becomes too shallow for resolution by specific target genes. Concentrations above the upper limit do not contribute directly to differential-repression mechanisms, but they provide a robust source that permits proper functioning of the gradient in heterozygous embryos that contain only one functional hb gene.
Figures
Similar articles
-
Morphogens: precise outputs from a variable gradient.Curr Biol. 2006 Jan 10;16(1):R29-31. doi: 10.1016/j.cub.2005.12.005. Curr Biol. 2006. PMID: 16401416
-
Enhancer of trithorax/polycomb, Corto, regulates timing of hunchback gene relocation and competence in Drosophila neuroblasts.Neural Dev. 2022 Feb 17;17(1):3. doi: 10.1186/s13064-022-00159-3. Neural Dev. 2022. PMID: 35177098 Free PMC article.
-
Gene regulation: boundaries within limits.Curr Biol. 2008 Aug 5;18(15):R653-R655. doi: 10.1016/j.cub.2008.06.040. Curr Biol. 2008. PMID: 18682204
-
Thoracic patterning by the Drosophila gap gene hunchback.Dev Biol. 2001 Sep 1;237(1):79-92. doi: 10.1006/dbio.2001.0355. Dev Biol. 2001. PMID: 11518507
-
Dynamics of maternal morphogen gradients in Drosophila.Curr Opin Genet Dev. 2008 Aug;18(4):342-7. doi: 10.1016/j.gde.2008.06.002. Epub 2008 Jul 21. Curr Opin Genet Dev. 2008. PMID: 18602472 Free PMC article. Review.
Cited by
-
Quantitative imaging of transcription in living Drosophila embryos links polymerase activity to patterning.Curr Biol. 2013 Nov 4;23(21):2140-5. doi: 10.1016/j.cub.2013.08.054. Epub 2013 Oct 17. Curr Biol. 2013. PMID: 24139738 Free PMC article.
-
Temporal coordination of gene networks by Zelda in the early Drosophila embryo.PLoS Genet. 2011 Oct;7(10):e1002339. doi: 10.1371/journal.pgen.1002339. Epub 2011 Oct 20. PLoS Genet. 2011. PMID: 22028675 Free PMC article.
-
Dampened regulates the activating potency of Bicoid and the embryonic patterning outcome in Drosophila.Nat Commun. 2013;4:2968. doi: 10.1038/ncomms3968. Nat Commun. 2013. PMID: 24336107 Free PMC article.
-
Combinatorial activation and concentration-dependent repression of the Drosophila even skipped stripe 3+7 enhancer.Development. 2011 Oct;138(19):4291-9. doi: 10.1242/dev.065987. Epub 2011 Aug 24. Development. 2011. PMID: 21865322 Free PMC article.
-
Anterior-posterior positional information in the absence of a strong Bicoid gradient.Proc Natl Acad Sci U S A. 2009 Mar 10;106(10):3823-8. doi: 10.1073/pnas.0807878105. Epub 2009 Feb 23. Proc Natl Acad Sci U S A. 2009. PMID: 19237583 Free PMC article.
References
-
- Kerszberg M, Wolpert L. Specifying positional information in the embryo: looking beyond morphogens. Cell. 2007;130:205–209. - PubMed
-
- Lawrence PA, Struhl G. Morphogens, compartments, and pattern: lessons from drosophila? Cell. 1996;85:951–961. - PubMed
-
- Wolpert L. Positional information and the spatial pattern of cellular differentiation. Journal of Theoretical Biology. 1969;25:1–47. - PubMed
-
- Driever W, Nusslein-Volhard C. A gradient of bicoid protein in Drosophila embryos. Cell. 1988;54:83–93. - PubMed
Publication types
MeSH terms
Substances
Grants and funding
LinkOut - more resources
Full Text Sources
Molecular Biology Databases
