

doi: 10.1016/j.jchromb.2008.06.001.
Epub 2008 Jun 6.
High-sensitivity analysis of glycosphingolipids by matrix-assisted laser desorption/ionization quadrupole ion trap time-of-flight imaging mass spectrometry on transfer membranes
Affiliations
- PMID: 18571485
- PMCID: PMC2551320
- DOI: 10.1016/j.jchromb.2008.06.001
Item in Clipboard
High-sensitivity analysis of glycosphingolipids by matrix-assisted laser desorption/ionization quadrupole ion trap time-of-flight imaging mass spectrometry on transfer membranes
J Chromatogr B Analyt Technol Biomed Life Sci.
.
Abstract
Glycosphingolipids are ubiquitous constituents of cells. Yet there is still room for improvement in the techniques for analyzing glycosphingolipids. Here we report our highly sensitive and convenient analytical technology with imaging mass spectrometry for detailed structural analysis of glycosphingolipids. We were able to determine detailed ceramide structures; i.e., both the sphingosine base and fatty acid, by MS/MS/MS analysis on a PVDF membrane with 10 pmol of GM1, with which only faint bands were visible by primuline staining. The limit of detection was approximately 1 pmol of GM1, which is lower than the value in the conventional reports (10 pmol).
Figures

Abbreviations correspond to the nomenclature of Svennerholm et al.[59]. It has been shown that major molecular species of GM1 from the bovine brain were d18:1/18:0 shown in (A) and d20:1/18:0 shown in (B)[57,58].

(A) The overall spectrum obtained from a GM1 band on the PVDF membrane. (B) An optical image of GM1 on thin-layer chromatogram stained with primuline. (C) and (D) Ion images obtained from GM1 of different ceramide moieties, m/z 1572 and 1544, respectively. (E) Ion images were merged with m/z 1572 shown in red and m/z 1544 in green. The arrow shows the direction of the raster scan.
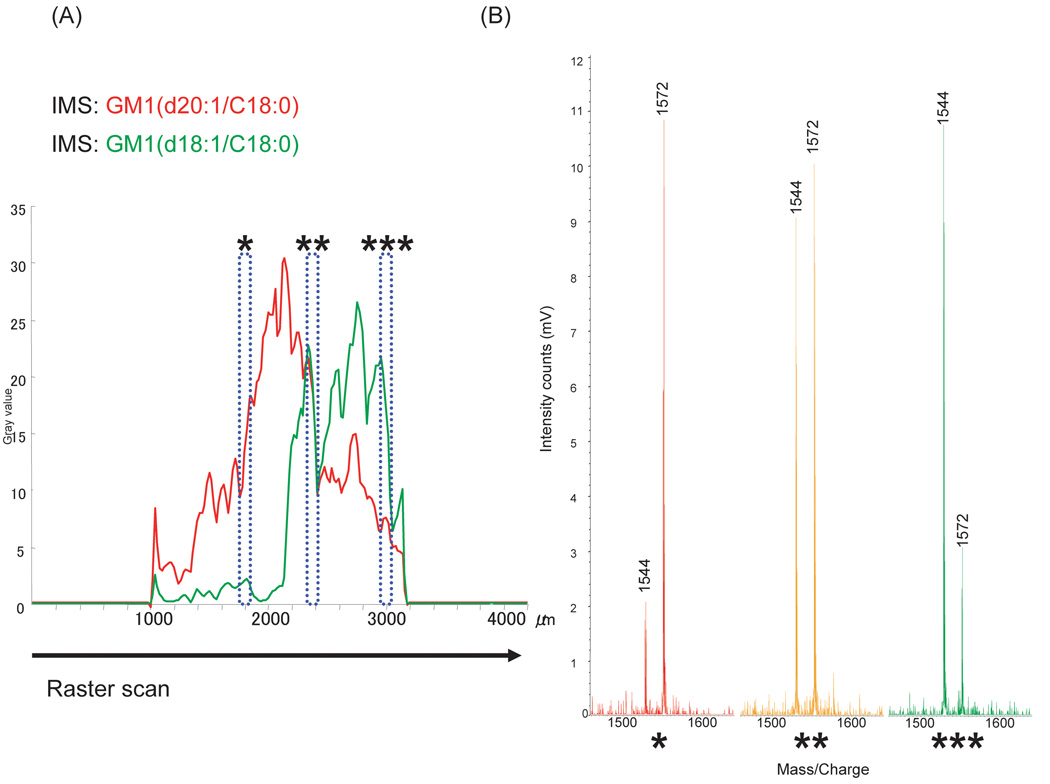
(A) The densitometric analysis of imaging data acquired from the raster scan of the GM1 band on the PVDF membrane (red, m/z 1572; green, m/z 1544). The X-axis indicates the distance from the top to the bottom pixel. The arrow shows the direction of the raster scan. (B) Semi-quantitative mass spectra acquired from the area with asterisks in (A). Each area of the rectangles with asterisks shows a parallel ratio between m/z 1572 and m/z 1544 in the mass spectrum with the same number of asterisks. (*; m/z 1572 was mainly observed, **; m/z 1572 and 1544 were equally detected, ***; m/z 1544 was mainly observed.)

(A) Thin-layer chromatogram stained with primuline. Lanes 1–8 contain bovine brain GM1: (lane 1–2) 1 nmol, (lane 3–4) 100 pmol, (lane 5–6) 10 pmol, and (lane 7–8) 1 pmol. The plate was developed with chloroform/methanol/0.2% aqueous CaCl2, (55/45/10, v/v/v), and GM1 spots were detected with primuline staining then transferred to a PVDF membrane. Each GM1 was directly analyzed by TLC-Blot-MALDI-QIT-TOF MS. (B), (C), (D), and (E) are spectra derived from 1 nmol (lane 1), 100 pmol (lane 3), 10 pmol (lane 5), and 1 pmol (lane 7) of GM1, respectively. The detection limit of GM1 was estimated at 1 pmol. The number of laser irradiations was 2 shots in arbitrarily 100 spots per band.

Annotations reported by Ann et al. are cited[60].
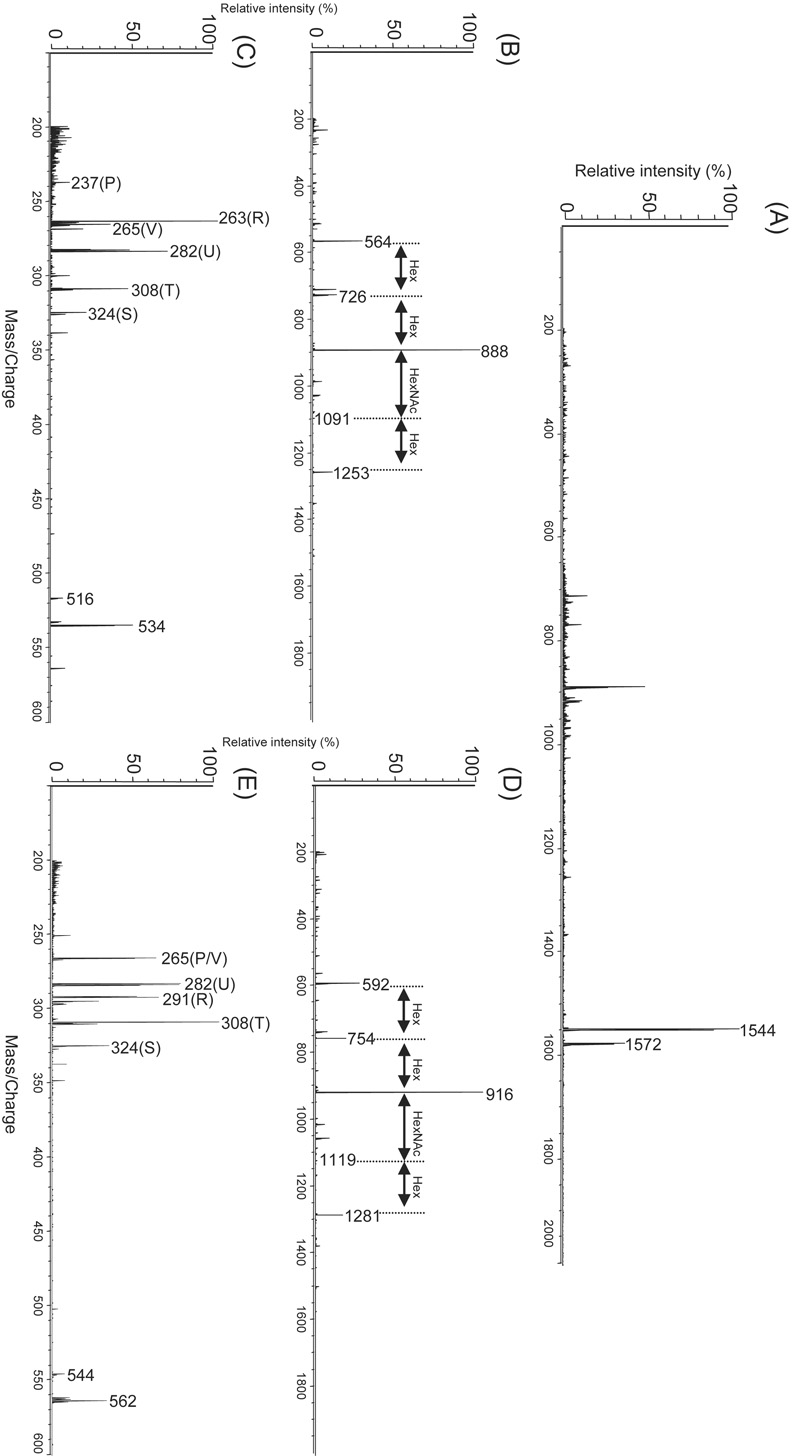
(A) MS spectrum; (B) MS/MS spectrum obtained with the precursor ion at m/z 1544; (C) MS/MS/MS spectrum obtained with the second precursor ion at m/z 564. (D) MS/MS spectrum obtained with the precursor ion at m/z 1572; (E) MS/MS/MS spectrum obtained with the second precursor ion at m/z 592.

(A)MS spectrum; (B) MS/MS spectrum obtained with the precursor ion at m/z 1544; (C) MS/MS/MS spectrum obtained with the second precursor ion at m/z 564. The detection limit of TLC-Blot-MALDI-QIT-TOF MS/MS/MS for structural identification of the ceramide moiety was found to be almost 10 pmol.

(A) Thin-layer chromatogram stained with primuline: (lane 1) GSLs standards (GM1, GD1a, GD1b, and GT1b); (lane 2) GSLs derived from the brain of a patient with Tay-Sachs disease and pooled to produce fraction X. The plate was developed with chloroform/methanol/0.2% aqueous CaCl2, (55/45/10, v/v/v), and spots were detected on the TLC plate by primuline staining and were then transferred onto a PVDF membrane. (a), (b), (c), and (d) represent the spectra derived from the band produced by fraction X, and (e) represents the spectrum corresponding to the GD1a standard. Each band was directly analyzed by TLC-Blot-MALDI-QIT-TOF MS and bands (a), (b), (c), and (d) were identified as sulfatide, GM2, GM1, and GalNAc-GD1a, respectively.
Similar articles
-
Structural characterization of neutral glycosphingolipids by thin-layer chromatography coupled to matrix-assisted laser desorption/ionization quadrupole ion trap time-of-flight MS/MS.Anal Chem. 2006 Aug 15;78(16):5736-43. doi: 10.1021/ac0605501. Anal Chem. 2006. PMID: 16906718
-
Direct matrix-assisted laser desorption/ionization mass spectrometric analysis of glycosphingolipids on thin layer chromatographic plates and transfer membranes.Rapid Commun Mass Spectrom. 1999;13(18):1838-49. doi: 10.1002/(SICI)1097-0231(19990930)13:18<1838::AID-RCM726>3.0.CO;2-9. Rapid Commun Mass Spectrom. 1999. PMID: 10482898
-
Convenient structural analysis of glycosphingolipids using MALDI-QIT-TOF mass spectrometry with increased laser power and cooling gas flow.J Biochem. 2006 Apr;139(4):771-7. doi: 10.1093/jb/mvj090. J Biochem. 2006. PMID: 16672278
-
Glycosphingolipid structural analysis and glycosphingolipidomics.Methods Enzymol. 2005;405:300-69. doi: 10.1016/S0076-6879(05)05012-3. Methods Enzymol. 2005. PMID: 16413319 Review.
-
Advances on the compositional analysis of glycosphingolipids combining thin-layer chromatography with mass spectrometry.Mass Spectrom Rev. 2010 May-Jun;29(3):425-79. doi: 10.1002/mas.20253. Mass Spectrom Rev. 2010. PMID: 19609886 Review.
Cited by
-
Bio-recognition and functional lipidomics by glycosphingolipid transfer technology.Proc Jpn Acad Ser B Phys Biol Sci. 2013;89(7):302-20. doi: 10.2183/pjab.89.302. Proc Jpn Acad Ser B Phys Biol Sci. 2013. PMID: 23883610 Free PMC article. Review.
-
MALDI imaging of lipid biochemistry in tissues by mass spectrometry.Chem Rev. 2011 Oct 12;111(10):6491-512. doi: 10.1021/cr200280p. Epub 2011 Sep 26. Chem Rev. 2011. PMID: 21942646 Free PMC article. No abstract available.
-
Developments and applications of mass microscopy.Med Mol Morphol. 2010 Mar;43(1):1-5. doi: 10.1007/s00795-009-0489-0. Epub 2010 Mar 26. Med Mol Morphol. 2010. PMID: 20339999 Review.
-
Lipidomics analysis revealed the phospholipid compositional changes in muscle by chronic exercise and high-fat diet.Sci Rep. 2013 Nov 20;3:3267. doi: 10.1038/srep03267. Sci Rep. 2013. PMID: 24253370 Free PMC article.
-
Imaging mass spectrometry: principle and application.Biophys Rev. 2009 Sep;1(3):131. doi: 10.1007/s12551-009-0015-6. Epub 2009 Sep 9. Biophys Rev. 2009. PMID: 28509996 Free PMC article. Review.
References
Publication types
MeSH terms
Substances
Grants and funding
LinkOut - more resources
Full Text Sources
