Comparative Study
. 2008 Jul 30;172(2):250-4.
doi: 10.1016/j.jneumeth.2008.05.003. Epub 2008 May 15.

The use of total protein stains as loading controls: an alternative to high-abundance single-protein controls in semi-quantitative immunoblotting

Affiliations
Comparative Study

The use of total protein stains as loading controls: an alternative to high-abundance single-protein controls in semi-quantitative immunoblotting

Georgina M Aldridge et al. J Neurosci Methods. .

Abstract

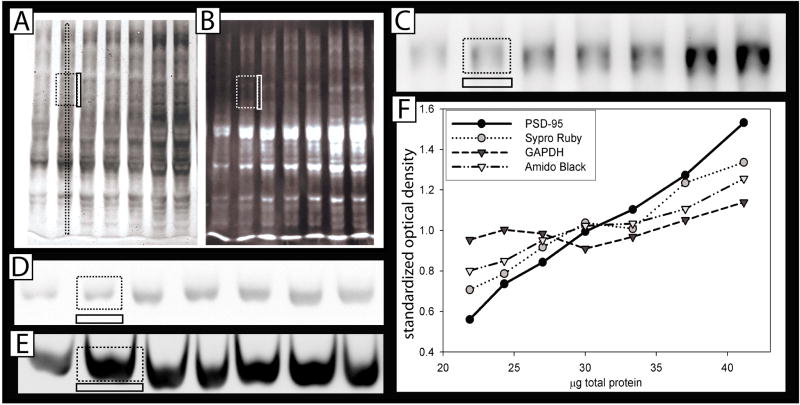
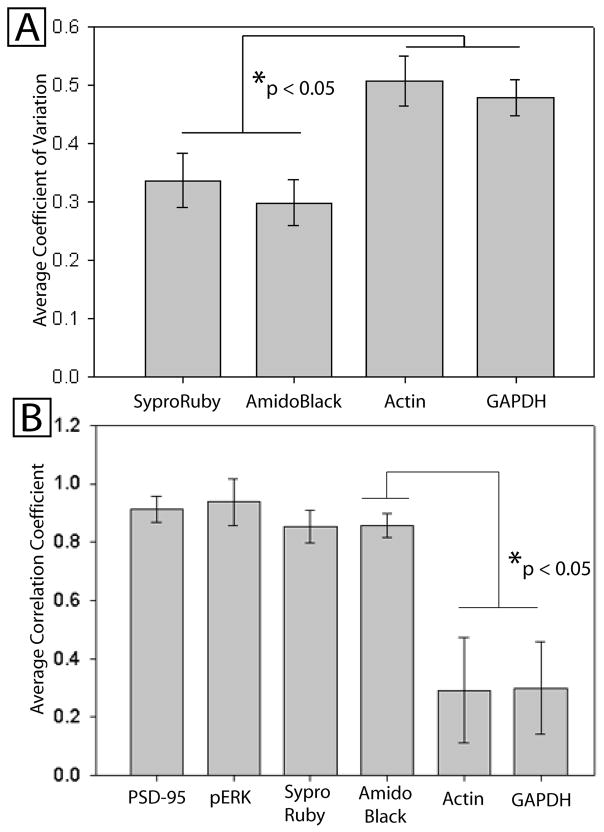
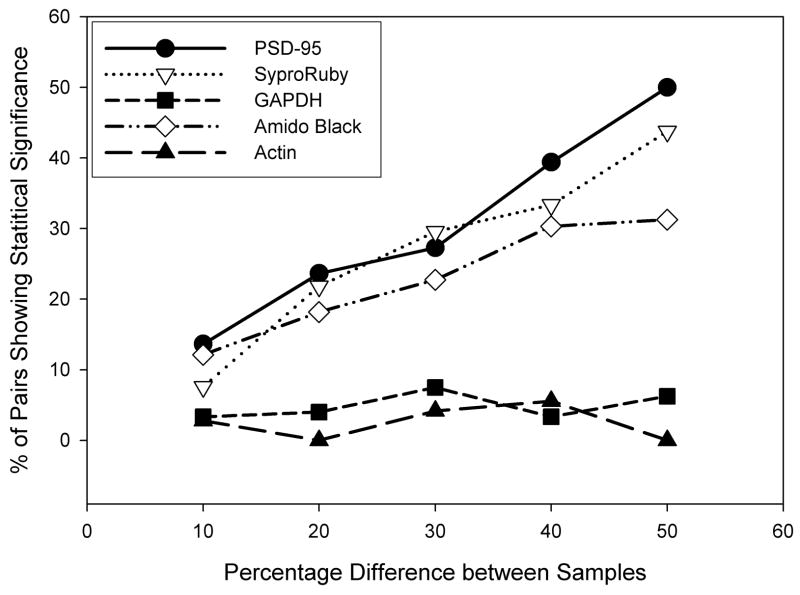
Western blots are used to estimate the relative concentrations of proteins of interest based on staining by specific antibodies. Quantitative measurements are often subject to error due to overloading of the loading control and over-reliance on normalization. We have found that at the protein concentrations normally used to quantify most low-abundance proteins of interest, frequently used single-protein loading controls, such as glyceraldehyde 3-phosphate dehydrogenase (GAPDH) and beta-actin, do not accurately reflect differences in protein concentration. Two total protein stains, SYPRO Ruby and Amido Black, were compared and found to be acceptable alternatives to single-protein controls. Although we cannot prove that high-abundance loading controls are inaccurate under all possible conditions, we conclude that the burden of proof should lie with the researcher to demonstrate that their loading control is reflective of quantitative differences in protein concentration.


Figures

Figure 1
Figure 1. Quantification of relative abundance using Western Blotting
Serial dilutions (21.9, 24.3, 27, 30, 33, 37 and 41μg of protein) derived from mouse cortex were run on SDS polyacrylamide gels. Large dotted rectangles represent quantified area (both a long strip or a smaller rectangle worked sufficiently to quantify total protein). Smaller, solid adjacent rectangles represent subtracted background, either between the lanes (for total stains) or below the bands (for single proteins). A: Amido black total protein stain, B: SYPRO® Ruby total protein stain, C: Representative blots stained with anti-PSD-95 D: anti-GAPDH (Santa Cruz.) and E: anti-GAPDH (sigma). F: Optical density at each protein concentration averaged over 10 blots, showing the different “relative abundance” slopes determined using each potential loading control. (β-actin and pERK were omitted for clarity, and because they were represented on <10 blots.) These data were examined statistically in figure 2B.
Figure 2
Figure 2
Serial dilutions between 21.9 and 41μg of protein homogenate were loaded in duplicate on each blot and stained both for the protein of interest (PSD-95) as well as each potential loading control. Relative optical density of the stain was used as a measure of abundance. A: The Average Coefficient of Variation (COV) of the “relative abundance” derived from the measure of PSD-95 normalized to each loading control. The COV is the standard deviation divided by the average normalized optical density, and should be low when the loading control accurately reflects loaded differences. There was an overall difference in COV based on loading control (F=5.6, p<0.01). B: The average correlation (over all blots) between the known amount of loaded protein and measured optical density of the loading control. There was an overall difference in correlation coefficients by loading control (F=10.4, p<0.001). Post hoc findings corrected for multiple comparisons are shown for both graphs.
Figure 3
Figure 3. Total protein stains are better than high-abundance loading controls at detecting known differences in protein level
The x-axis indicates the known concentration difference (ranging from 10–50%) between individual lanes containing serial dilutions, in order to test for the ability to determine these differences experimentally. The y-axis depicts the percentage of possible pairs that, within a blot, were able to demonstrate a statistical difference (in the correct direction) between concentrations run in duplicate (p < 0.05).

References

    1. Alexander M, Curtis G, Avruch J, Goodman HM. Insulin regulation of protein biosynthesis in differentiated 3T3 adipocytes. Regulation of glyceraldehyde-3-phosphate dehydrogenase. J Biol Chem. 1985;260:11978–85. - PubMed
    1. Asaka Y, Jugloff DG, Zhang L, Eubanks JH, Fitzsimonds RM. Hippocampal synaptic plasticity is impaired in the Mecp2-null mouse model of Rett syndrome. Neurobiol Dis. 2006;21:217–27. - PubMed
    1. Dittmer A, Dittmer J. Beta-actin is not a reliable loading control in Western blot analysis. Electrophoresis. 2006;27:2844–5. - PubMed
    1. Huggett J, Dheda K, Bustin S, Zumla A. Real-time RT-PCR normalisation; strategies and considerations. Genes and immunity. 2005;6:279–84. - PubMed
    1. Kitchener P, Di Blasi F, Borrelli E, Piazza PV. Differences between brain structures in nuclear translocation and DNA binding of the glucocorticoid receptor during stress and the circadian cycle. Eur J Neurosci. 2004;19:1837–46. - PubMed

Publication types

MeSH terms