

A quantitative review of the ubiquitous relapse curve
- PMID: 18571890
- PMCID: PMC3151675
- DOI: 10.1016/j.jsat.2008.04.001
A quantitative review of the ubiquitous relapse curve
Abstract
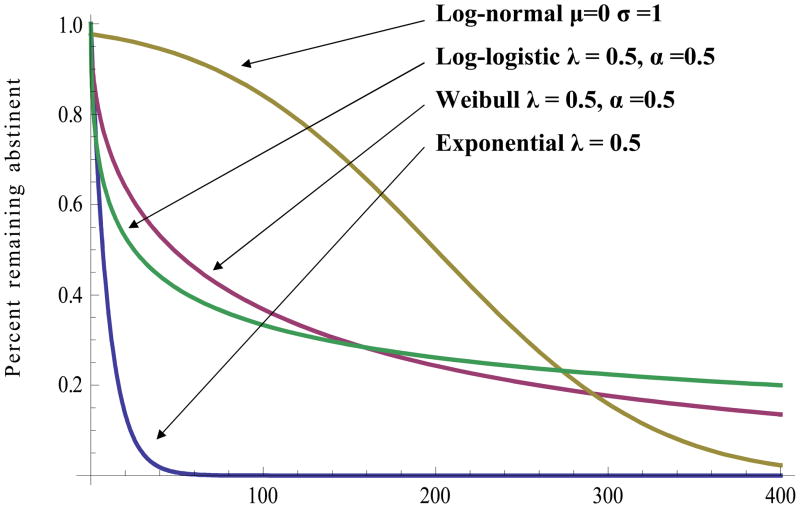
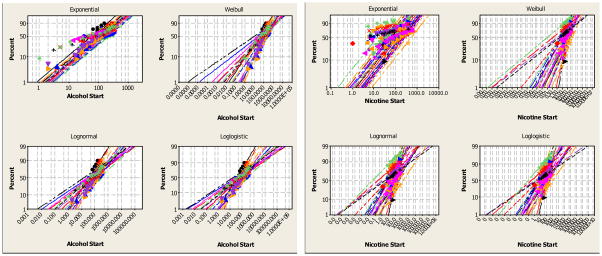
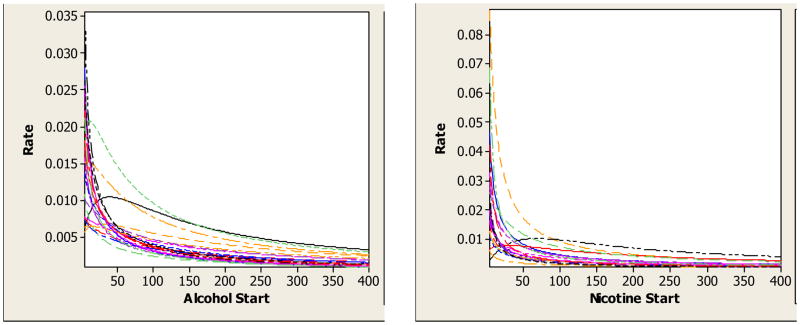
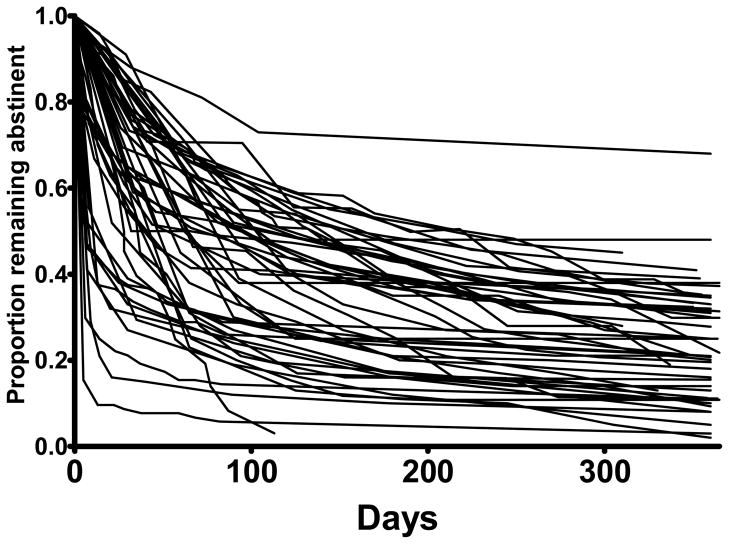
The primary goal of this study is to ascertain whether relapse to drug dependence, in terms of continuous abstinence assessment, exhibits a typical pattern that can be characterized by a common quantitative function. If the relapse curve is indeed ubiquitous, then some underlying mechanism must be operating to shape the curve that transcends variables such as drug class, population, or treatment type. Survival analyses are performed on 20 alcohol and tobacco treatment studies using the proportions of individuals remaining abstinent after a period of initial abstinence. Several parametric models of relapse are compared, and the results demonstrate that a log-logistic distribution is the most accurate reflection of the available data and the basic shape of the relapse curve is uniform. In most reports examined, the rate of relapse decelerates after initial abstinence has been achieved, and therefore, the amount of accumulated time abstinent may be the transcending variable that operates to shape the relapse curve.
Figures
Similar articles
-
Rates and correlates of relapse among individuals in remission from DSM-IV alcohol dependence: a 3-year follow-up.Alcohol Clin Exp Res. 2007 Dec;31(12):2036-45. doi: 10.1111/j.1530-0277.2007.00536.x. Alcohol Clin Exp Res. 2007. PMID: 18034696
-
Smoking cessation and alcohol abstinence: what do the data tell us?Alcohol Res Health. 2006;29(3):208-12. Alcohol Res Health. 2006. PMID: 17373411 Free PMC article. Review.
-
A Randomized Trial Evaluating Whether Topiramate Aids Smoking Cessation and Prevents Alcohol Relapse in Recovering Alcohol-Dependent Men.Alcohol Clin Exp Res. 2017 Jan;41(1):197-206. doi: 10.1111/acer.13279. Epub 2016 Dec 28. Alcohol Clin Exp Res. 2017. PMID: 28029173 Free PMC article. Clinical Trial.
-
Adolescent tobacco use and substance abuse treatment outcomes.J Subst Abuse Treat. 2009 Jul;37(1):17-24. doi: 10.1016/j.jsat.2008.09.006. Epub 2008 Nov 12. J Subst Abuse Treat. 2009. PMID: 19004603 Free PMC article.
-
[Pharmacological relapse prevention in alcohol and tobacco dependence].Internist (Berl). 2007 Jan;48(1):79-84, 86-8. doi: 10.1007/s00108-006-1755-z. Internist (Berl). 2007. PMID: 17122900 Review. German.
Cited by
-
Sex Differences in Motivation to Self-Administer Alcohol After 2 Weeks of Abstinence in Young-Adult Heavy Drinkers.Alcohol Clin Exp Res. 2018 Oct;42(10):1897-1908. doi: 10.1111/acer.13860. Epub 2018 Aug 29. Alcohol Clin Exp Res. 2018. PMID: 30080254 Free PMC article.
-
Excessive discounting of delayed reinforcers as a trans-disease process contributing to addiction and other disease-related vulnerabilities: emerging evidence.Pharmacol Ther. 2012 Jun;134(3):287-97. doi: 10.1016/j.pharmthera.2012.02.004. Epub 2012 Feb 22. Pharmacol Ther. 2012. PMID: 22387232 Free PMC article. Review.
-
Health Behavior Changes During COVID-19 Pandemic and Subsequent "Stay-at-Home" Orders.Int J Environ Res Public Health. 2020 Aug 28;17(17):6268. doi: 10.3390/ijerph17176268. Int J Environ Res Public Health. 2020. PMID: 32872179 Free PMC article.
-
Psilocybin-assisted therapy for relapse prevention in alcohol use disorder: a phase 2 randomized clinical trial.EClinicalMedicine. 2025 Mar 14;82:103149. doi: 10.1016/j.eclinm.2025.103149. eCollection 2025 Apr. EClinicalMedicine. 2025. PMID: 40144690 Free PMC article.
-
A Reinforcer Pathology perspective on relapse.J Exp Anal Behav. 2020 Jan;113(1):48-56. doi: 10.1002/jeab.564. Epub 2019 Dec 2. J Exp Anal Behav. 2020. PMID: 31789442 Free PMC article.
References
-
- Allsop S, Saunders B, Phillips M, Carr A. A trial of relapse prevention with severely dependent male problem drinkers. Addiction. 1997;92:61–74. - PubMed
-
- Bouton ME. Context and behavioral processes in extinction. Learning and Memory. 2004;11:485–494. - PubMed
-
- Brownell KD, Marlatt GA, Lichtenstein E, Wilson GT. Understanding and preventing relapse. American Psychologist. 1986;41(7):765–782. - PubMed
-
- Chambers J, Cleveland W, Kleiner B, Tukey P. Graphical Methods for Data Analysis; Wadsworth statistic/probability series. Chapman and Hall Publishing/SRC press; New York; New York: 1983.
-
- Daughton DM, Fortmann SP, Glover ED, Hatsukami DK, Heatley SA, Lichtenstein E, Repsher L, Millatmal T, Killen JD, Nowak RT, Ulrich F, Patil KD, Rennard SI. The smoking cessation efficacy of varying doses of nicotine patch delivery systems 4 to 5 years post-quit day. Preventive Medicine. 1999;28:113–118. - PubMed
Publication types
MeSH terms
Grants and funding
LinkOut - more resources
Full Text Sources
Medical
