. 2008 Dec;44(6):604-15.
doi: 10.1016/j.ceca.2008.05.001. Epub 2008 Jun 24.

Synergistic regulation of endogenous TRPM2 channels by adenine dinucleotides in primary human neutrophils

Affiliations

Synergistic regulation of endogenous TRPM2 channels by adenine dinucleotides in primary human neutrophils

Ingo Lange et al. Cell Calcium. 2008 Dec.

Abstract

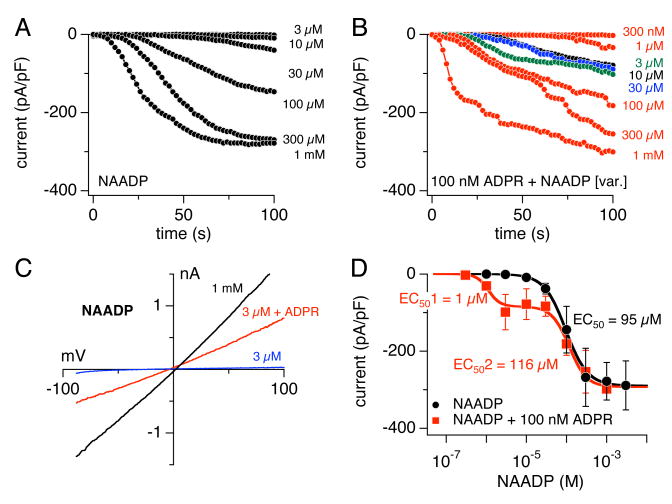
The Ca(2+)-permeable TRPM2 channel is a dual function protein that is activated by intracellular ADPR through its enzymatic pyrophosphatase domain with Ca(2+) acting as a co-factor. Other TRPM2 regulators include cADPR, NAADP and H(2)O(2), which synergize with ADPR to potentiate TRPM2 activation. Although TRPM2 has been thoroughly characterized in overexpression or cell-line systems, little is known about the features of TRPM2 in primary cells. We here characterize the regulation of TRPM2 activation in human neutrophils and report that ADPR activates TRPM2 with an effective half-maximal concentration (EC(50)) of 1microM. Potentiation by Ca(2+) is dose-dependent with an EC(50) of 300nM. Both cADPR and NAADP activate TRPM2, albeit with lower efficacy than in the presence of subthreshold levels of ADPR (100nM), which significantly shifts the EC(50) for cADPR from 44 to 3muM and for NAADP from 95 to 1microM. TRPM2 activation by ADPR can be suppressed by AMP with an IC(50) of 10microM and cADPR-induced activation can be blocked by 8-Bromo-cADPR. We further show that 100microM H(2)O(2) enables subthreshold concentrations of ADPR (100nM) to activate TRPM2. We conclude that agonistic and antagonistic characteristics of TRPM2 as seen in overexpression systems are largely compatible with the functional properties of TRPM2 currents measured in human neutrophils, but the potencies of agonists in primary cells are significantly higher.


Figures

Figure 1
Figure 1. Ca2+ facilitates activation of TRPM2 currents in the presence of ADPR
(A) Average normalized TRPM2 currents activated by ADPR in human neutrophils. Currents were measured with a voltage ramp from −100 mV to +100 mV over 50 ms at 0.5 Hz intervals from a holding potential of 0 mV. Inward current amplitudes were extracted at −80 mV, averaged and plotted versus time. Cells were perfused with the standard intracellular K+-based solution in the absence of exogenous Ca2+ buffers and supplemented with increasing ADPR concentrations as indicated (n = 4-10). Standard extracellular solution contained 1 mM Ca2+. (B) Average normalized TRPM2 currents activated by 1 mM ADPR and variable intracellular Ca2+ concentrations as indicated (n = 5-9). Currents were analyzed as in (A). (C) Current-voltage (I/V) curve taken from a representative cell perfused with 30 μM ADPR. (D) Dose-response curves of ADPR-induced TRPM2 currents in unbuffered (black circles, n = 4-10) and in clamped Ca2+ internal solutions at 1 mM fixed ADPR (red circles, n = 5-9). Data were plotted against ADPR or Ca2+ concentrations and fitted with dose-response curves. The EC50 values are indicated in the panel. Hill coefficients were 1.5 for unbuffered and 2 for clamped Ca2+. Data were acquired as described in (A). To establish the dose-response curves, the peak inward currents at −80 mV were extracted, averaged and plotted versus the respective ADPR or Ca2+ concentration. (E) Average normalized TRPM2 inward currents at −80 mV evoked by 1 μM ADPR in the absence (black circles, n = 9) or presence of 100 μM AMP (red circles, n = 6). Error bars represent S.E.M. (F) Dose-response curve of TRPM2 currents for AMP in the presence of 1 μM ADPR (black circles, n = 5 - 6). Normalized current amplitudes were measured at 100 s into the experiment, averaged and plotted versus the respective AMP concentration. The data point for 1 μM ADPR in the absence of AMP is plotted in the graph for reference (red circle, n = 9). A fit to the data gave an IC50 of 10 μM AMP with a Hill coefficient of 2.
Figure 2
Figure 2. Perforated patch and single-channel experiments
(A) Combined amphotericin-induced perforated-patch and Fura-2 experiments (see methods). The upper trace depicts average perforated-patch whole-cell currents using standard internal solution in the absence of ADPR (n = 3). The lower trace shows the average cellular Ca2+ signal measured in parallel in the same cells (n =3). Cells were superfused with standard extracellular solution devoid of Ca2+ and supplemented with 2 μM ionomycin for 5 sec as indicated by the two arrows, respectively. Standard voltage ramps were applied from a holding potential of 0 mV. Error bars represent S.E.M. (B) Single-channel activity of a representative cell during consecutive voltage ramps applied in the whole-cell configuration. The cell was perfused with 200 nM ADPR and two channels were active (dotted lines indicate channel open levels). A fit to the data gave a single channel conductance of 43 pS ± 0.4 pS (n = 3) at negative potentials and 63 ± 2 pS (n = 3) at positive potentials.
Figure 3
Figure 3. ADPR and cADPR synergize and 8-Bromo-cADPR inhibits TRPM2 currents
(A) Average normalized TRPM2 currents activated by cADPR in human neutrophils (n = 4-9). Intracellular conditions and data acquisition/analysis were as in Fig. 1A. (B) Average normalized TRPM2 currents activated by various cADPR concentrations in the presence of 100 nM ADPR (n = 5-7). Intracellular conditions and data acquisition/analysis as in (A). (C) I/V curves taken from representative cells perfused with 1 mM cADPR (black trace), 3 μM cADPR (blue trace) or 3 μM cADPR + 100 nM ADPR (red trace). (D) Dose-response curves of TRPM2 currents evoked by ADPR (black circles, same data set as in Fig. 1), cADPR (blue circles, n = 4-9) or subthreshold ADPR (100 nM) + increasing cADPR concentrations (red circles, n = 5-7) in unbuffered K+-based internal solution. Current amplitudes were plotted against concentrations and fitted with dose-response curves. The EC50 values are indicated in the panel. Hill coefficients were 1 for cADPR and 2 for cADPR with 100 nM ADPR. To establish the dose-response curves, the peak inward currents at −80 mV were extracted, averaged and plotted versus the respective ADPR or cADPR concentration. (E) Average normalized TRPM2 inward currents at −80 mV evoked by 100 nM ADPR and in the absence (open circles, n = 6) or presence of 100 μM H2O2 in the patch pipette (closed circles, n = 6). 100 μM H2O2 in the pipette without any ADPR did not evoke any currents (open squares, n = 6). Note that the ADPR-only data are overlapping with the H2O2 time course and are hidden from view. Error bars represent S.E.M. (F) Average normalized TRPM2 inward currents at −80 mV evoked by 30 μM cADPR and in the absence (black circles, n = 7) or presence of 100 μM 8-Br-cADPR (red circles, n = 6). Error bars represent S.E.M.
Figure 4
Figure 4. ADPR and NAADP synergize to activate TRPM2 currents
(A) Average normalized TRPM2 currents activated by NAADP in human neutrophils (n = 3-5). Intracellular conditions and data acquisition/analysis were as in Fig. 1A. (B) Average normalized TRPM2 currents activated by various NAADP concentrations in the presence of 100 nM ADPR (n = 5-9). Intracellular conditions and data acquisition/analysis as in (A). (C) I/V curves taken from representative cells perfused with 1 mM NAADP (black trace), 3 μM NAADP (blue trace) or 3 μM NAADP + 100 nM ADPR (red trace). (D) Dose-response curves of TRPM2 currents evoked by NAADP (black circles, n = 3-5) or subthreshold ADPR (100 nM) + increasing NAADP concentrations (red squares, n = 5-9) in unbuffered K+-based internal solution. Current amplitudes were plotted against concentrations and fitted with dose-response curves. The EC50 values are indicated in the panel. Hill coefficient was 1.6 for NAADP. A two-component dose-response curve was fitted to the NAADP data supplemented with 100 nM fixed ADPR. Here, the Hill coefficients were 3 for EC501 and 2 for EC502.

Similar articles

Cited by

References

    1. Fleig A, Penner R. The TRPM ion channel subfamily: molecular, biophysical and functional features. Trends Pharmacol Sci. 2004;25:633–9. - PubMed
    1. Hara Y, Wakamori M, Ishii M, Maeno E, Nishida M, Yoshida T, Yamada H, Shimizu S, Mori E, Kudoh J, Shimizu N, Kurose H, Okada Y, Imoto K, Mori Y. LTRPC2 Ca2+-permeable channel activated by changes in redox status confers susceptibility to cell death. Mol Cell. 2002;9:163–73. - PubMed
    1. Harteneck C. Function and pharmacology of TRPM cation channels. Naunyn Schmiedebergs Arch Pharmacol. 2005;371:307–14. - PubMed
    1. Perraud AL, Fleig A, Dunn CA, Bagley LA, Launay P, Schmitz C, Stokes AJ, Zhu Q, Bessman MJ, Penner R, Kinet JP, Scharenberg AM. ADP-ribose gating of the calcium-permeable LTRPC2 channel revealed by Nudix motif homology. Nature. 2001;411:595–9. - PubMed
    1. Sano Y, Inamura K, Miyake A, Mochizuki S, Yokoi H, Matsushime H, Furuichi K. Immunocyte Ca2+ influx system mediated by LTRPC2. Science. 2001;293:1327–30. - PubMed

Publication types