

Neuronal gene expression in non-demented individuals with intermediate Alzheimer's Disease neuropathology
- PMID: 18572275
- PMCID: PMC2844804
- DOI: 10.1016/j.neurobiolaging.2008.05.013
Neuronal gene expression in non-demented individuals with intermediate Alzheimer's Disease neuropathology
Abstract
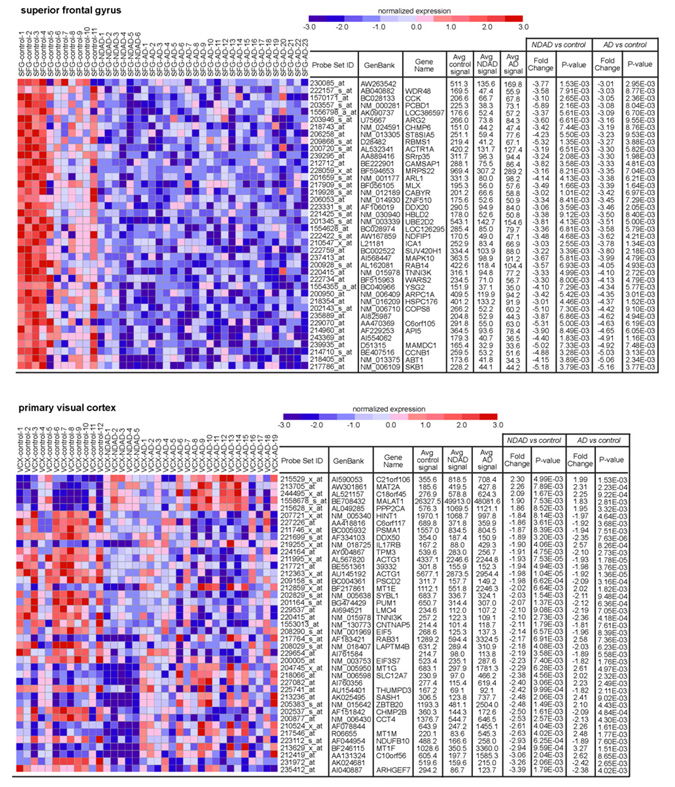
While the clinical and neuropathological characterization of Alzheimer's Disease (AD) is well defined, our understanding of the progression of pathologic mechanisms in AD remains unclear. Post-mortem brains from individuals who did not fulfill clinical criteria for AD may still demonstrate measurable levels of AD pathologies to suggest that they may have presented with clinical symptoms had they lived longer or are able to stave off disease progression. Comparison between such individuals and those clinically diagnosed and pathologically confirmed to have AD will be key in delineating AD pathogenesis and neuroprotection. In this study, we expression profiled laser capture microdissected non-tangle bearing neurons in 6 post-mortem brain regions that are differentially affected in the AD brain from 10 non-demented individuals demonstrating intermediate AD neuropathologies (NDAD; Braak stage of II through IV and CERAD rating of moderate to frequent) and evaluated this data against that from individuals who have been diagnosed with late onset AD as well as healthy elderly controls. We identified common statistically significant expression changes in both NDAD and AD brains that may establish a degenerative link between the two cohorts, in addition to NDAD specific transcriptomic changes. These findings pinpoint novel targets for developing earlier diagnostics and preventative therapies for AD prior to diagnosis of probable AD. We also provide this high-quality, low post-mortem interval (PMI), cell-specific, and region-specific NDAD/AD reference data set to the community as a public resource.
Copyright (c) 2008 Elsevier Inc. All rights reserved.
Conflict of interest statement
The authors state that there are no actual or potential conflicts of interest.
Figures


References
-
- Barrachina M, Castano E, Ferrer I. TaqMan PCR assay in the control of RNA normalization in human post-mortem brain tissue. Neu-rochem. Int. 2006;49(3):276–284. - PubMed
-
- Belizaire R, Komanduri C, Wooten K, Chen M, Thaller C, Janz R. Characterization of synaptogyrin 3 as a new synaptic vesicle protein. J. Comp. Neurol. 2004;470(3):266–281. - PubMed
-
- Benson DL, Colman DR, Huntley GW. Molecules, maps and synapse specificity. Nat. Rev. Neurosci. 2001;2(12):899–909. - PubMed
-
- Blesa R, Mohr E, Miletich RS, Hildebrand K, Sampson M, Chase TN. Cerebral metabolic changes in Alzheimer’s disease: neu-robehavioral patterns. Dementia. 1996;7(5):239–245. - PubMed
Publication types
MeSH terms
Substances
Grants and funding
- P 50 AG05681/AG/NIA NIH HHS/United States
- P01 AG03991/AG/NIA NIH HHS/United States
- K01AG024079/AG/NIA NIH HHS/United States
- R01-5U24NS051872/NS/NINDS NIH HHS/United States
- P30 AG19610/AG/NIA NIH HHS/United States
- P30 AG019610/AG/NIA NIH HHS/United States
- R01 AG023193/AG/NIA NIH HHS/United States
- P50 AG005128/AG/NIA NIH HHS/United States
- R01 AG031581/AG/NIA NIH HHS/United States
- U24 NS051872/NS/NINDS NIH HHS/United States
- K01 AG024079/AG/NIA NIH HHS/United States
- U01AG016976/AG/NIA NIH HHS/United States
- AG05128/AG/NIA NIH HHS/United States
- U01 AG016976/AG/NIA NIH HHS/United States
- P01 AG003991/AG/NIA NIH HHS/United States
- P50 AG005681/AG/NIA NIH HHS/United States
- R21 AG029576/AG/NIA NIH HHS/United States
- 1-RO1-AG023193/AG/NIA NIH HHS/United States
LinkOut - more resources
Full Text Sources
Medical
