. 2008 Jun 23:5:9.
doi: 10.1186/1742-9994-5-9.

Development of the retinotectal system in the direct-developing frog Eleutherodactylus coqui in comparison with other anurans

Affiliations

Development of the retinotectal system in the direct-developing frog Eleutherodactylus coqui in comparison with other anurans

Gerhard Schlosser. Front Zool. .

Abstract

Background: Frogs primitively have a biphasic life history with an aquatic larva (tadpole) and a usually terrestrial adult. However, direct developing frogs of the genus Eleutherodactylus have lost a free living larval stage. Many larval structures never form during development of Eleutherodactylus, while limbs, spinal cord, and an adult-like cranial musculoskeletal system develop precociously.

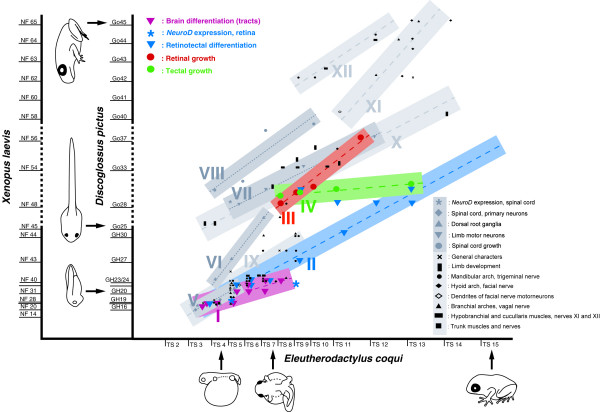
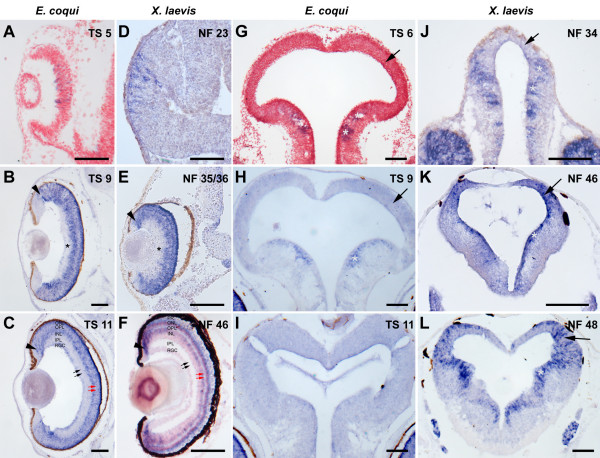
Results: Here, I compare growth and differentiation of the retina and tectum and development of early axon tracts in the brain between Eleutherodactylus coqui and the biphasically developing frogs Discoglossus pictus, Physalaemus pustulosus, and Xenopus laevis using morphometry, immunohistochemical detection of proliferating cell nuclear antigen (PCNA) and acetylated tubulin, biocytin tracing, and in situ hybridization for NeuroD. Findings of the present study indicate that retinotectal development was greatly altered during evolution of Eleutherodactlyus mostly due to acceleration of cell proliferation and growth in retina and tectum. However, differentiation of retina, tectum, and fiber tracts in the embryonic brain proceed along a conserved slower schedule and remain temporally coordinated with each other in E. coqui.

Conclusion: These findings reveal a mosaic pattern of changes in the development of the central nervous system (CNS) during evolution of the direct developing genus Eleutherodactylus. Whereas differentiation events in directly interconnected parts of the CNS such as retina, tectum, and brain tracts remained coordinated presumably due to their interdependent development, they were dissociated from proliferation control and from differentiation events in other parts of the CNS such as the spinal cord. This suggests that mosaic evolutionary changes reflect the modular character of CNS development.


Figures

Figure 1
Figure 1
Heterochrony plot comparing the timing of retinotectal and brain development (colored symbols, suites of characters I-IV) with development of the spinal cord (grey symbols, suites of characters V-VIII) and other characters (black symbols, suites of characters IX-XII) in E. coqui and D. pictus (modified, corrected, and supplemented from [28]). X and Y axes represent time axes, along which stages of development are indicated. To facilitate comparisons, the approximate correspondence of stages of D. pictus [86,87] with stages of X. laevis [88]) are also indicated. The duration of the larval period (dashed part of Y axis) in D. pictus and X. laevis is variable and is represented here in a very telescoped fashion. All symbols in the plot except the asterisks represent developmental events (e.g., outgrowth of retinofugal fibers), whose timing in E. coqui is plotted against timing in D. pictus (for detailed list see below). The asterisks compare timing of NeuroD expression between X. laevis and E. coqui. Timing of events is based on data reported in this paper as well as [18,19,21,28,29]; a few data on limb development are taken from [9] and from [93] on D. sardus. For a detailed list of developmental events see Tables 1 and 2 (colored symbols) and references [21,28] (black and grey symbols). Whereas suites of developmental events conserved between two species compared in a heterochrony plot are expected to plot along a diagonal line, temporal dissociations (heterochronic shifts) are indicated by deviations from such a pattern [21]. The distribution of events in this heterochrony plot reveals multiple heterochronic shifts of developmental events between E. coqui and D. pictus. While retinotectal differentiation (blue triangles; suite II) remains temporally coordinated with early development of the CNS (pink triangles; suite I), early differentiation of the spinal cord (grey squares; suite V), and early embryonic development of many cranial structures (black symbols; suite IX) in E. coqui, the formation of lateral motor columns and innervation of the limbs (grey triangles; suite VII) is predisplaced into early embryonic stages paralleling precocious onset of limb development (black symbols; suite X) in E. coqui. The formation of dorsal root ganglia also occurs earlier in E. coqui (grey triangles; suite VI). Growth of the retina (red circles; suite III), the tectum (green circles; suite IV), and the spinal cord (grey circles; suite VIII) all occur relatively early in E. coqui. Metamorphic remodeling of cranial structures (black symbols; suites XI and XII) occurs immediately after embryonic cranial development (black symbols; suite IX) in E. coqui.
Figure 2
Figure 2
Retinal development in E. coqui and D. pictus. (A, B) Morphometric analysis of retinal development (modified from [29]). Cross-sectional area of the central retina (light blue) or of its cellular layer (dark blue) is plotted against developmental age. In addition, a proliferative index indicating the PCNA positive proportion of the cellular layer is shown in green. Each symbol represents a measurement from a single individual (there are less data points for the proliferative index than for area measurements because PCNA staining was not apparent in each individual). Curves are drawn through mean values in case more than one individual per stage was analyzed. For each species, timing of first outgrowth of axons from retinal ganglion cells (RGC), the first retinofugal fibers in the optic chiasm, the formation of inner and outer plexiform layers (IPL and OPL, respectively) and of a distinct layer of photoreceptor (PR) outer segments in the retina are indicated in red. For D. pictus the approximate duration of larval and metamorphic phases are emphasized, while for E. coqui, which lacks a free-living larva, the time of hatching is shown (at hatching, E. coqui corresponds to frogs at the end of metamorphosis with respect to many characters). In each graph, one scale unit of the abscissa represents 1 day of development at 24°C, except for larval stages of D. pictus, which are of variable duration and are represented here in an extremely telescoped way. TS 15+6, TS 15+10 and Go 45+8 refer to stages at 6 and 10 days posthatching (E. coqui) or 8 days postmetamorphosis (D. pictus), respectively. (C) Overview of retinal development in E. coqui and D. pictus based on camera lucida drawings of sections through the central retina of different developmental stages. Hatched lines indicate plexiform layers, the inner nuclear layer is sandwiched in between. Stippling indicates PCNA-positive regions.
Figure 3
Figure 3
Tectal development in E. coqui and D. pictus. (A, B) Morphometric analysis of tectal development. Volume of the entire optic tectum (light blue) or of its cellular layer (dark blue) is plotted against developmental age. In addition, a proliferative index indicating the PCNA positive proportion of the cellular layer is shown in green. Each symbol represents a measurement from a single individual (there are less data points for the proliferative index than for area measurements because PCNA staining was not apparent in each individual). Curves are drawn through mean values in case more than one individual per stage was analyzed. For each species, timing of first outgrowth of tectofugal fibers, first ingrowth of optic (retinofugal) fibers into the tectum, the formation of tectal layers 7–9, 5, and 1–4, and the coverage of the entire surface of the tectum by optic fibers is indicated in red. Phases of development are depicted as described in Fig. 2. (C) Overview of tectal development in E. coqui and D. pictus based on camera lucida drawings of sections through the central tectum of different developmental stages. Hatched line indicates border between cellular layers adjacent to the ventricle and peripheral fiber layers. Within the tectum, the hatched line indicates border between layers 1–6 (mostly cellular) and layers 7–9 (mostly fibers). Stippling indicates PCNA-positive regions.
Figure 4
Figure 4
Cell proliferation during tectal development in E. coqui (A-C) and D. pictus (D-F) as revealed by immunostaining for proliferating cell nuclear antigen (PCNA) in transverse paraffine sections. The border of the optic tectum is indicated on the right side of each panel. Tectal layers are identified by numbers in panels C and F. At early embryonic stages of both species (A, D), the optic tectum is very small and all tectal cells are PCNA immunoreactive (orange or brown nuclei). At later embryonic stages (B, E), the tectum of E. coqui has enormously grown in size, while the tectum of D. pictus is still small (note different magnification). While the entire ventricular layer remains PCNA immunoreactive, the first non-proliferating cells are evident (arrows). At hatching, the tectum of E. coqui (C) resembles the tectum of D. pictus at an early larval stage (F): tectal layers 5 and 7–9 have differentiated, while PCNA immunopositive cells continue to be present along the entire ventricular surface. Bar: 100 μm in all panels.
Figure 5
Figure 5
Neurogenesis in the retina and tectum of E. coqui (A-C, G-I) and X. laevis (D-F, J-L) as revealed by in situ hybridization for NeuroD in transverse paraffine sections. A-F: At early embryonic stages, NeuroD begins to be expressed in scattered cells throughout the retina in both species (A, D). Subsequently, most retinal cells express NeuroD, until NeuroD is downregulated in the central, inner part of the retina (asterisks) at midembryonic stages of both species (B, E). The retina of E. coqui has grown to much larger size at this stage than the retina of X. laevis (note different magnification). At later stages, NeuroD expression is restricted to the ciliary margin (arrowheads), the outer part of the inner nuclear layer and the outer nuclear layer in both species (C,F) and to scattered cells in the retinal ganglion cell layer in E. coqui. The inner and outer plexiform layers (black and red arrows, respectively) are much thinner in E. coqui than in X. laevis. G-L: In contrast to X. laevis (J-L), in which the tectum (arrows) expresses NeuroD from stage NF 46 on, the tectum of E. coqui never shows strong NeuroD expression at any stage (G-I) although expression is evident in other parts of the midbrain similar to X. laevis (asterisks). Abbreviations: INL: inner nuclear layer; IPL: inner plexiform layer; ONL: outer nuclear layer; OPL: outer plexiform layer; PR: layer of photoreceptor outer segments; RGC: retinal ganglion cell layer. Bar: 100 μm in all panels.
Figure 6
Figure 6
Contralateral retinotectal projections in E. coqui (A-C) and D. pictus (D-F) as revealed by biocytin tracing. At two days before hatching, the optic projections of E. coqui (A, B) resemble early larvae of D. pictus (E, F). After crossing in the optic chiasm (OC) the majority of retinofugal fibers forms the marginal optic tract, which courses dorsally in the thalamus and forms a first terminal field in the rostral visual nucleus (RVN; this probably corresponds to the nucleus lateralis of [32]) (A, E). Retinofugal fibers extend further until the optic tectum and cover approximately its rostral half (B, F). In E. coqui, the density of optic fibers on the tectal surface (see arrows in magnified inset of B) is much sparser than in D. pictus. At 12 days after hatching, optic fibers have reached the caudal end of the tectum in E. coqui, but do not yet extend towards its midline (C: section through midtectum; arrowheads indicate medial limit of coverage). In contrast, optic fibers cover the entire tectum in D. pictus at the end of metamorphic climax (G: section through midtectum). Bar: 100 μm in all panels.
Figure 7
Figure 7
Development of early fiber tracts in the brain of E. coqui (A-C) and D. pictus (D-F) as revealed by immunohistochemistry for acetylated tubulin. Asterisks indicate the optic stalk in all panels. A, D: The tract of the postoptic commissure and its associated commissure are the first fiber tracts to form in the embryonic forebrain of both species (boxed area in A is shown at a more lateral level of focus). B, E: At midembryonic stages, a more complex scaffold of tracts has formed. C, F: Camera lucida drawings of embryos with all major fiber tracts indicated. In E. coqui, fibers run ventrad along the lateral surface of the thalamus, but no dorsoventral diencephalic tract of tightly bundled fibers is observed (indicated as "DVDT ?"). Abbreviations: AC: anterior commissure; Cer: cerebellum; CPT: commissure of the posterior tuberculum; DVDT: dorsoventral diencephalic tract; Ep: Epiphysis; HC: Habenular commissure; ITC: intertectal commissure; NII: optic nerve; NV: trigeminal nerve; NVII/VIII: facial and vestibulocochlear nerves; PC: posterior commissure; POC: postoptic commissure; Ret: retina (hatched circle); SOT: supraoptic tract; TAC: tract of the anterior commissure; THC: tract of the habenular commissure; Tel: telencephalon; TO: optic tectum; TCC: tract of the cerebellar commissure; TCPT: tract of the commissure of the posterior tuberculum; TPC: tract of the posterior commissure; TPOC: tract of the postoptic commissure; TV: descending tract of the trigeminal nerve; TVTC: tract of the ventral tegmental commissure; TVIII: descending tract of the vestibulocochlear nerve; VLT: ventral longitudinal tract. Bar: 100 μm in all panels.

Similar articles

Cited by

References

    1. Dodd MHI, Dodd JM. The biology of metamorphosis. In: Lofts B, editor. Physiology of the amphibia III. New York: Academic Press; 1976. pp. 467–599.
    1. Brown DD, Cai L. Amphibian metamorphosis. Dev Biol. 2007;306:20–33. - PMC - PubMed
    1. Szarski H. The origin of the larva and metamorphosis in amphibia. Am Nat. 1957;91:283–301.
    1. Wassersug RJ, Hoff K. Developmental changes in the orientation of the anuran jaw suspension. Evol Biol. 1982;15:223–246.
    1. Wake MH. Phylogenesis of direct development and viviparity in vertebrates. In: Wake DB, Roth G, editor. Complex organismal functions: integration and evolution in vertebrates. Chichester: Wiley; 1989. pp. 235–250.

LinkOut - more resources