

Covariance of maximum likelihood evolutionary distances between sequences aligned pairwise
- PMID: 18573206
- PMCID: PMC2443136
- DOI: 10.1186/1471-2148-8-179
Covariance of maximum likelihood evolutionary distances between sequences aligned pairwise
Abstract
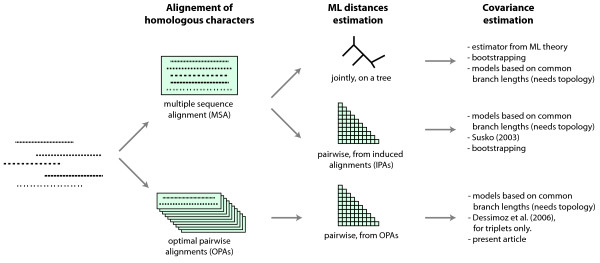
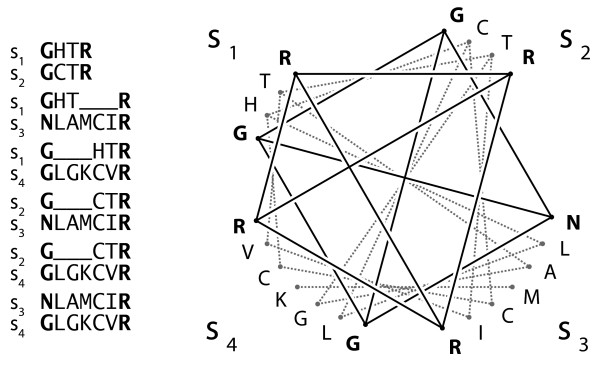
Background: The estimation of a distance between two biological sequences is a fundamental process in molecular evolution. It is usually performed by maximum likelihood (ML) on characters aligned either pairwise or jointly in a multiple sequence alignment (MSA). Estimators for the covariance of pairs from an MSA are known, but we are not aware of any solution for cases of pairs aligned independently. In large-scale analyses, it may be too costly to compute MSAs every time distances must be compared, and therefore a covariance estimator for distances estimated from pairs aligned independently is desirable. Knowledge of covariances improves any process that compares or combines distances, such as in generalized least-squares phylogenetic tree building, orthology inference, or lateral gene transfer detection.
Results: In this paper, we introduce an estimator for the covariance of distances from sequences aligned pairwise. Its performance is analyzed through extensive Monte Carlo simulations, and compared to the well-known variance estimator of ML distances. Our covariance estimator can be used together with the ML variance estimator to form covariance matrices.
Conclusion: The estimator performs similarly to the ML variance estimator. In particular, it shows no sign of bias when sequence divergence is below 150 PAM units (i.e. above ~29% expected sequence identity). Above that distance, the covariances tend to be underestimated, but then ML variances are also underestimated.
Figures


Similar articles
-
Fast and accurate estimation of the covariance between pairwise maximum likelihood distances.PeerJ. 2014 Sep 25;2:e583. doi: 10.7717/peerj.583. eCollection 2014. PeerJ. 2014. PMID: 25279263 Free PMC article.
-
Scoredist: a simple and robust protein sequence distance estimator.BMC Bioinformatics. 2005 Apr 27;6:108. doi: 10.1186/1471-2105-6-108. BMC Bioinformatics. 2005. PMID: 15857510 Free PMC article.
-
Fast estimation of the difference between two PAM/JTT evolutionary distances in triplets of homologous sequences.BMC Bioinformatics. 2006 Dec 5;7:529. doi: 10.1186/1471-2105-7-529. BMC Bioinformatics. 2006. PMID: 17147817 Free PMC article.
-
Performance comparison between k-tuple distance and four model-based distances in phylogenetic tree reconstruction.Nucleic Acids Res. 2008 Mar;36(5):e33. doi: 10.1093/nar/gkn075. Epub 2008 Feb 22. Nucleic Acids Res. 2008. PMID: 18296485 Free PMC article.
-
On the quality of tree-based protein classification.Bioinformatics. 2005 May 1;21(9):1876-90. doi: 10.1093/bioinformatics/bti244. Epub 2005 Jan 12. Bioinformatics. 2005. PMID: 15647305
Cited by
-
The evolutionary rate dynamically tracks changes in HIV-1 epidemics: application of a simple method for optimizing the evolutionary rate in phylogenetic trees with longitudinal data.Epidemics. 2009 Dec;1(4):230-9. doi: 10.1016/j.epidem.2009.10.003. Epub 2009 Nov 12. Epidemics. 2009. PMID: 21352769 Free PMC article.
-
ALF--a simulation framework for genome evolution.Mol Biol Evol. 2012 Apr;29(4):1115-23. doi: 10.1093/molbev/msr268. Epub 2011 Dec 8. Mol Biol Evol. 2012. PMID: 22160766 Free PMC article.
-
Fast and accurate estimation of the covariance between pairwise maximum likelihood distances.PeerJ. 2014 Sep 25;2:e583. doi: 10.7717/peerj.583. eCollection 2014. PeerJ. 2014. PMID: 25279263 Free PMC article.
References
-
- Dessimoz C, Cannarozzi G, Gil M, Margadant D, Roth A, Schneider A, Gonnet G. In: RECOMB 2005 Workshop on Comparative Genomics, Volume LNBI 3678 of Lecture Notes in Bioinformatics. McLysath A, Huson DH, editor. Springer-Verlag; 2005. OMA, A Comprehensive, Automated Project for the Identification of Orthologs from Complete Genome Data: Introduction and First Achievements; pp. 61–72.
MeSH terms
LinkOut - more resources
Full Text Sources
Miscellaneous
