The trypanosome transcriptome is remodelled during differentiation but displays limited responsiveness within life stages
- PMID: 18573209
- PMCID: PMC2443814
- DOI: 10.1186/1471-2164-9-298
The trypanosome transcriptome is remodelled during differentiation but displays limited responsiveness within life stages
Abstract
Background: Trypanosomatids utilise polycistronic transcription for production of the vast majority of protein-coding mRNAs, which operates in the absence of gene-specific promoters. Resolution of nascent transcripts by polyadenylation and trans-splicing, together with specific rates of mRNA turnover, serve to generate steady state transcript levels that can differ in abundance across several orders of magnitude and can be developmentally regulated. We used a targeted oligonucleotide microarray, representing the strongly developmentally-regulated T. brucei membrane trafficking system and approximately 10% of the Trypanosoma brucei genome, to investigate both between-stage, or differentiation-dependent, transcriptome changes and within-stage flexibility in response to various challenges.
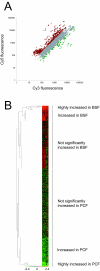
Results: 6% of the gene cohort are developmentally regulated, including several small GTPases, SNAREs, vesicle coat factors and protein kinases both consistent with and extending previous data. Therefore substantial differentiation-dependent remodeling of the trypanosome transcriptome is associated with membrane transport. Both the microarray and qRT-PCR were then used to analyse transcriptome changes resulting from specific gene over-expression, knockdown, altered culture conditions and chemical stress. Firstly, manipulation of Rab5 expression results in co-ordinate changes to clathrin protein expression levels and endocytotic activity, but no detectable changes to steady-state mRNA levels, which indicates that the effect is mediated post-transcriptionally. Secondly, knockdown of clathrin or the variant surface glycoprotein failed to perturb transcription. Thirdly, exposure to dithiothreitol or tunicamycin revealed no evidence for a classical unfolded protein response, mediated in higher eukaryotes by transcriptional changes. Finally, altered serum levels invoked little transcriptome alteration beyond changes to expression of ESAG6/7, the transferrin receptor.
Conclusion: While trypanosomes regulate mRNA abundance to effect the major changes accompanying differentiation, a given differentiated state appears transcriptionally inflexible. The implications of the absence of a transcriptome response in trypanosomes for both virulence and models of life cycle progression are discussed.
Figures


Similar articles
-
Genome-wide analysis of mRNA abundance in two life-cycle stages of Trypanosoma brucei and identification of splicing and polyadenylation sites.Nucleic Acids Res. 2010 Aug;38(15):4946-57. doi: 10.1093/nar/gkq237. Epub 2010 Apr 12. Nucleic Acids Res. 2010. PMID: 20385579 Free PMC article.
-
Post-transcriptional control of nuclear-encoded cytochrome oxidase subunits in Trypanosoma brucei: evidence for genome-wide conservation of life-cycle stage-specific regulatory elements.Nucleic Acids Res. 2006;34(18):5312-24. doi: 10.1093/nar/gkl598. Epub 2006 Sep 29. Nucleic Acids Res. 2006. PMID: 17012283 Free PMC article.
-
Transcriptome Profiling of Trypanosoma brucei Development in the Tsetse Fly Vector Glossina morsitans.PLoS One. 2016 Dec 21;11(12):e0168877. doi: 10.1371/journal.pone.0168877. eCollection 2016. PLoS One. 2016. PMID: 28002435 Free PMC article.
-
Transcription of protein-coding genes in trypanosomes by RNA polymerase I.Annu Rev Microbiol. 1997;51:463-89. doi: 10.1146/annurev.micro.51.1.463. Annu Rev Microbiol. 1997. PMID: 9343357 Review.
-
Life-cycle differentiation in Trypanosoma brucei: molecules and mutants.Biochem Soc Trans. 2000 Oct;28(5):531-6. doi: 10.1042/bst0280531. Biochem Soc Trans. 2000. PMID: 11044369 Review.
Cited by
-
Rab23 is a flagellar protein in Trypanosoma brucei.BMC Res Notes. 2011 Jun 15;4:190. doi: 10.1186/1756-0500-4-190. BMC Res Notes. 2011. PMID: 21676215 Free PMC article.
-
Sending the message: specialized RNA export mechanisms in trypanosomes.Trends Parasitol. 2022 Oct;38(10):854-867. doi: 10.1016/j.pt.2022.07.008. Epub 2022 Aug 24. Trends Parasitol. 2022. PMID: 36028415 Free PMC article. Review.
-
The endoplasmic reticulum of trypanosomatids: An unrevealed road for chemotherapy.Front Cell Infect Microbiol. 2022 Nov 10;12:1057774. doi: 10.3389/fcimb.2022.1057774. eCollection 2022. Front Cell Infect Microbiol. 2022. PMID: 36439218 Free PMC article. Review.
-
A Trypanosoma brucei protein required for maintenance of the flagellum attachment zone and flagellar pocket ER domains.Protist. 2012 Jul;163(4):602-15. doi: 10.1016/j.protis.2011.10.010. Epub 2011 Dec 18. Protist. 2012. PMID: 22186015 Free PMC article.
-
Widespread variation in transcript abundance within and across developmental stages of Trypanosoma brucei.BMC Genomics. 2009 Oct 19;10:482. doi: 10.1186/1471-2164-10-482. BMC Genomics. 2009. PMID: 19840382 Free PMC article.
References
-
- Barry JD. Capping of variable antigen on Trypanosoma brucei, and its immunological and biological significance. J Cell Sci. 1979;37:287–302. - PubMed
Publication types
MeSH terms
Substances
Grants and funding
LinkOut - more resources
Full Text Sources
Molecular Biology Databases

