. 2008 Sep;76(9):4019-37.
doi: 10.1128/IAI.00208-08. Epub 2008 Jun 23.

Global gene expression as a function of the iron status of the bacterial cell: influence of differentially expressed genes in the virulence of the human pathogen Vibrio vulnificus

Affiliations

Global gene expression as a function of the iron status of the bacterial cell: influence of differentially expressed genes in the virulence of the human pathogen Vibrio vulnificus

Alejandro F Alice et al. Infect Immun. 2008 Sep.

Abstract

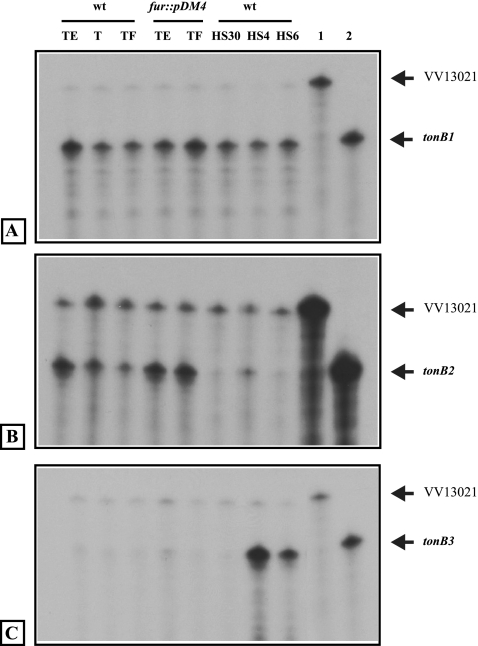
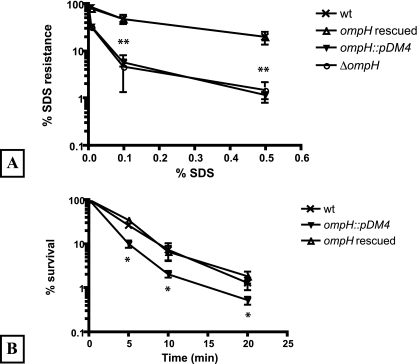
Vibrio vulnificus multiplies rapidly in host tissues under iron-overloaded conditions. To understand the effects of iron in the physiology of this pathogen, we performed a genome-wide transcriptional analysis of V. vulnificus growing at three different iron concentrations, i.e., iron-limiting [Trypticase soy broth with 1.5% NaCl (TSBS) plus ethylenediamine-di-(o-hydroxyphenylacetic) acid (EDDA)], low-iron (1 microg Fe/ml; TSBS), and iron-rich (38 microg Fe/ml; TSBS plus ferric ammonium citrate) concentrations. A few genes were upregulated under the last two conditions, while several genes were expressed differentially under only one of them. A gene upregulated under both conditions encodes the outer membrane porin, OmpH, while others are related to the biosynthesis of amino sugars. An ompH mutant showed sensitivity to sodium dodecyl sulfate (SDS) and polymyxin B and also had a reduced competitive index compared with the wild type in the iron-overloaded mice. Under iron-limiting conditions, two of the TonB systems involved in vulnibactin transport were induced. These genes were essential for virulence in the iron-overloaded mice inoculated subcutaneously, underscoring the importance of active iron transport in infection, even under the high-iron conditions of this animal model. Furthermore, we demonstrated that a RyhB homologue is also essential for virulence in the iron-overloaded mouse. This novel information on the role of genes induced under iron limitation in the iron-overloaded mouse model and the finding of new genes with putative roles in virulence that are expressed only under iron-rich conditions shed light on the many strategies used by this pathogen to multiply rapidly in the susceptible host.


Figures

FIG. 1.
FIG. 1.
RPA of tonB genes. RNA samples were extracted from the wild-type strain growing under the following conditions: TSBS plus EDDA (TE), TSBS (T), TSBS plus FAC (TF), and human serum with the addition of FAC at 250 μg/ml after 30 min (HS30), 4 h (HS4), and 6 h (HS6) of incubation. RNA samples extracted from fur::pDM4 cells growing in TSBS plus EDDA and TSBS plus FAC are also shown. Arrows indicate the positions of the internal control probe (VV13021) in lanes 1 and the corresponding tonB gene probe without RNase treatment in lanes 2. (A) tonB1; (B) tonB2; (C) tonB3.
FIG. 2.
FIG. 2.
Gel shift of the promoter regions of TonB1, TonB2, and TAD-1 with Fur(His)6. Promoter regions located upstream of the first gene in each cluster were amplified and labeled as described in Materials and Methods and then incubated with increasing concentrations of Fur(His)6 as shown in each panel. (A) TonB1 promoter; (B) TonB2 promoter; (C) TAD-1 promoter. Indicated are free labeled DNA and Fur(His)6-DNA complexes. The rightmost lane in each panel shows the competition between labeled DNA and unlabeled DNA (500 nM).
FIG. 3.
FIG. 3.
CI for iron transport mutant strains. Mixtures of the strains analyzed (0.1 ml) were injected s.c. into iron-overloaded animals. When animals showed signs of disease, organs were removed and homogenized and bacterial cells were plated on TSAS-X-Gal plates. Bars represent the geometric mean CI value for each organ. Experiments were performed at least twice. ***, P < 0.0001.
FIG. 4.
FIG. 4.
Expression of the TonB1, TonB2, and TonB3 clusters of genes in human serum. The promoter region of each cluster was cloned in front of the promoterless lacZ gene in the pTL61T vector, and plasmids were conjugated into the ΔlacZ strain. (A) Cells were grown in human serum (HS), human serum plus FAC at 2 μg/ml (HS + 2), human serum plus FAC at 20 μg/ml (HS + 20), and human serum plus FAC at 200 μg/ml (HS + 200), and samples were taken at different time points to determine β-galactosidase activities. Due to the turbidity of the human serum, OD600 values were not recorded and activities were normalized to 106 CFU/ml. (B) Cells harboring the VV10842-lacZ fusion were grown in TSBS to an OD600 of ∼0.6 and inoculated in TSBS or human serum (HS), and samples were taken at different time points (T0, 0 h; T1, 1 h; and T3, 3 h) to determine β-galactosidase activities. Enzymatic activities were determined as described for panel A. The results shown in panels A and B are the means for at least three independent experiments, with standard deviations.
FIG. 5.
FIG. 5.
RPA of tadA genes. RNA samples were extracted as described in Materials and Methods from the wild type growing in TSBS plus EDDA (TE), TSBS (T), or TSBS plus FAC (TF) or from the fur::pDM4 mutant growing in TSBS plus FAC (TF). Arrows indicate the positions of the internal control probe without the addition of RNase (VV13021) (lanes C) and the corresponding tadA gene probe (lane A-1, tadA1; lane A-2, tadA2; and lane A-3, tadA3). (A) tadA1; (B) tadA2 (left) and tadA3 (right).
FIG. 6.
FIG. 6.
CI of several mutants. Cells were grown and experiments conducted as described in the legend to Fig. 3. (A) fur::pDM4 ΔlacZ mutant versus wild type (n = 5); (B) ΔryhB ΔlacZ mutant versus wild type (n = 5); (C) ΔryhB lacZ::ryhB mutant versus wild type (n = 5); (D) ΔryhB fur::pDM4 ΔlacZ mutant versus wild type (n = 5). Bars represent the geometric mean CI value for each organ. Experiments were conducted at least twice. ***, P < 0.0001.
FIG. 7.
FIG. 7.
Growth curves under iron-limiting conditions. Cells were grown overnight in TSBS and diluted in TSBS plus 50 μM EDDA, and the OD600 was recorded at various time points. The mean and the standard deviation for each time point for at least two independent experiments are shown.
FIG. 8.
FIG. 8.
CI of ompH mutants. Cells were grown and experiments conducted as described in the legend to Fig. 3. (Left) CI between the ompH rescued strain and the ΔlacZ mutant (n = 5); (right) CI obtained for the ompH::pDM4 strain versus the ΔlacZ mutant (n = 5). Bars represent the geometric mean CI value for each organ. The P values obtained for each comparison are shown. Experiments were conducted at least twice.
FIG. 9.
FIG. 9.
Sensitivities of ompH mutants to SDS and polymyxin B. (A) Cells were grown overnight in TSBS and then diluted 1/100 in TSBS with various SDS concentrations, and the OD600 was measured after 2 h of growth. The percentage of SDS resistance is relative to that of the culture without SDS, calculated as described in Materials and Methods. The results shown are the means for three independent experiments, with standard deviations. **, P < 0.01. (B) Cells were grown overnight in TSBS and then diluted 1/100 in TSBS, and when the cells reached mid-log phase, 20 μg/ml polymyxin B was added. A tube with TSBS was used as a control. Samples were taken at determined time points, and serial dilutions were performed in PBS and plated on TSAS plates. The percentage of survival is relative to that of the culture without polymyxin B, as described in Materials and Methods. The results shown are the means for at least three independent experiments, with standard deviations. *, P < 0.05.
FIG. 10.
FIG. 10.
Analysis of glmR and glmS genes. (A) RPA of the glmS gene. (Right) RNA samples were extracted from the wild type and the ΔglmR mutant growing in TSBS plus EDDA (TE) or TSBS plus FAC (TF). (Left) RNA samples were extracted from the ΔglmR mutant harboring the pMGlmR vector or the empty vector pMMB208 and growing in TSBS plus EDDA (TE) or TSBS plus FAC (TF). Arrows indicate the positions of the internal control probe without the addition of RNase (VV13021) (lanes 2) and the glmS gene probe (lanes 1). (B) CI of the ΔglmR mutant. Cells were grown and experiments conducted as described in the legend to Fig. 3. Bars represent the geometric mean CI value for each organ. Data are representative of three independent experiments. The asterisks indicate the P value for comparison of spleen with skin and spleen with liver, as follows: *, P < 0.01; **, P < 0.02.

References

    1. Adams, B. D., R. Lazova, N. C. Andrews, and L. M. Milstone. 2005. Iron in skin of mice with three etiologies of systemic iron overload. J. Investig. Dermatol. 1251200-1205. - PMC - PubMed
    1. Altschul, S. F., W. Gish, W. Miller, E. W. Myers, and D. J. Lipman. 1990. Basic local alignment search tool. J. Mol. Biol. 215403-410. - PubMed
    1. Bensing, B. A., B. J. Meyer, and G. M. Dunny. 1996. Sensitive detection of bacterial transcription initiation sites and differentiation from RNA processing sites in the pheromone-induced plasmid transfer system of Enterococcus faecalis. Proc. Natl. Acad. Sci. USA 937794-7799. - PMC - PubMed
    1. Blanvillain, S., D. Meyer, A. Boulanger, M. Lautier, C. Guynet, N. Denance, J. Vasse, E. Lauber, and M. Arlat. 2007. Plant carbohydrate scavenging through TonB-dependent receptors: a feature shared by phytopathogenic and aquatic bacteria. PLoS ONE 2e224. - PMC - PubMed
    1. Bolstad, B. M., R. A. Irizarry, M. Astrand, and T. P. Speed. 2003. A comparison of normalization methods for high density oligonucleotide array data based on variance and bias. Bioinformatics 19185-193. - PubMed

Publication types

MeSH terms