

Iron-independent phosphorylation of iron regulatory protein 2 regulates ferritin during the cell cycle
- PMID: 18574241
- PMCID: PMC2527096
- DOI: 10.1074/jbc.M803005200
Iron-independent phosphorylation of iron regulatory protein 2 regulates ferritin during the cell cycle
Abstract
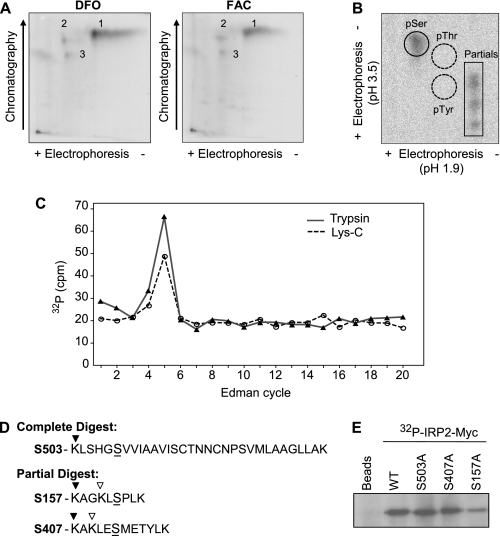
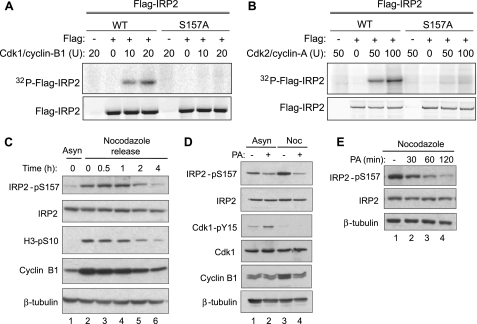
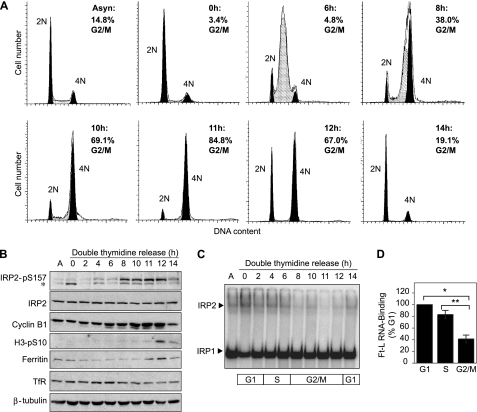
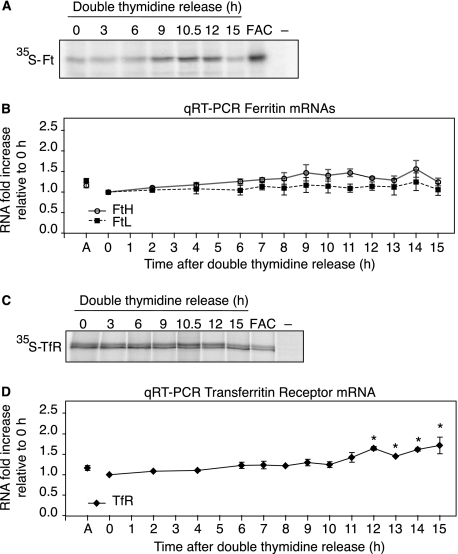
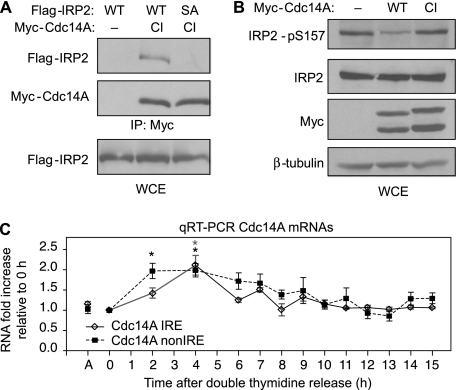
Iron regulatory protein 2 (IRP2) is a key iron sensor that post-transcriptionally regulates mammalian iron homeostasis by binding to iron-responsive elements (IREs) in mRNAs that encode proteins involved in iron metabolism (e.g. ferritin and transferrin receptor 1). During iron deficiency, IRP2 binds IREs to regulate mRNA translation or stability, whereas during iron sufficiency IRP2 is degraded by the proteasome. Here, we identify an iron-independent IRP2 phosphorylation site that is regulated by the cell cycle. IRP2 Ser-157 is phosphorylated by Cdk1/cyclin B1 during G(2)/M and is dephosphorylated during mitotic exit by the phosphatase Cdc14A. Ser-157 phosphorylation during G(2)/M reduces IRP2 RNA-binding activity and increases ferritin synthesis, whereas Ser-157 dephosphorylation during mitotic exit restores IRP2 RNA-binding activity and represses ferritin synthesis. These data show that reversible phosphorylation of IRP2 during G(2)/M has a role in modulating the iron-independent expression of ferritin and other IRE-containing mRNAs during the cell cycle.
Figures
Similar articles
-
Multiple, conserved iron-responsive elements in the 3'-untranslated region of transferrin receptor mRNA enhance binding of iron regulatory protein 2.J Biol Chem. 2002 Nov 8;277(45):42579-87. doi: 10.1074/jbc.M207918200. Epub 2002 Aug 27. J Biol Chem. 2002. PMID: 12200453
-
Iron regulation and the cell cycle: identification of an iron-responsive element in the 3'-untranslated region of human cell division cycle 14A mRNA by a refined microarray-based screening strategy.J Biol Chem. 2006 Aug 11;281(32):22865-74. doi: 10.1074/jbc.M603876200. Epub 2006 Jun 7. J Biol Chem. 2006. PMID: 16760464
-
Excess capacity of the iron regulatory protein system.J Biol Chem. 2007 Aug 24;282(34):24650-9. doi: 10.1074/jbc.M703167200. Epub 2007 Jun 28. J Biol Chem. 2007. PMID: 17604281
-
The role of iron regulatory proteins in mammalian iron homeostasis and disease.Nat Chem Biol. 2006 Aug;2(8):406-14. doi: 10.1038/nchembio807. Nat Chem Biol. 2006. PMID: 16850017 Review.
-
Iron metabolism and the IRE/IRP regulatory system: an update.Ann N Y Acad Sci. 2004 Mar;1012:1-13. doi: 10.1196/annals.1306.001. Ann N Y Acad Sci. 2004. PMID: 15105251 Review.
Cited by
-
Iron regulatory proteins: players or pawns in ferroptosis and cancer?Front Mol Biosci. 2023 Jun 29;10:1229710. doi: 10.3389/fmolb.2023.1229710. eCollection 2023. Front Mol Biosci. 2023. PMID: 37457833 Free PMC article. Review.
-
Regulation of cellular iron metabolism.Biochem J. 2011 Mar 15;434(3):365-81. doi: 10.1042/BJ20101825. Biochem J. 2011. PMID: 21348856 Free PMC article. Review.
-
Mammalian iron metabolism and its control by iron regulatory proteins.Biochim Biophys Acta. 2012 Sep;1823(9):1468-83. doi: 10.1016/j.bbamcr.2012.05.010. Epub 2012 May 17. Biochim Biophys Acta. 2012. PMID: 22610083 Free PMC article. Review.
-
Iron-Sulfur Clusters and Iron Responsive Element Binding Proteins Mediate Iron Accumulation in Corneal Endothelial Cells in Fuchs Dystrophy.Invest Ophthalmol Vis Sci. 2025 Apr 1;66(4):23. doi: 10.1167/iovs.66.4.23. Invest Ophthalmol Vis Sci. 2025. PMID: 40202733 Free PMC article.
-
Inhibition of IRP2-dependent reprogramming of iron metabolism suppresses tumor growth in colorectal cancer.Cell Commun Signal. 2024 Aug 23;22(1):412. doi: 10.1186/s12964-024-01769-6. Cell Commun Signal. 2024. PMID: 39180081 Free PMC article.
References
-
- Hentze, M. W., Muckenthaler, M. U., and Andrews, N. C. (2004) Cell 117285 –297 - PubMed
-
- Dunn, L. L., Rahmanto, Y. S., and Richardson, D. R. (2007) Trends Cell Biol. 1793 –100 - PubMed
-
- Nyholm, S., Mann, G. J., Johansson, A. G., Bergeron, R. J., Graslund, A., and Thelander, L. (1993) J. Biol. Chem. 26826200 –26205 - PubMed
-
- Kulp, K. S., Green, S. L., and Vulliet, P. R. (1996) Exp. Cell Res. 22960 –68 - PubMed
-
- Gao, J., and Richardson, D. R. (2001) Blood 98842 –850 - PubMed
Publication types
MeSH terms
Substances
Grants and funding
LinkOut - more resources
Full Text Sources
Molecular Biology Databases
Miscellaneous
