. 2008 Jun;350(1-3):165-174.
doi: 10.1016/j.chemphys.2008.01.050.

Ultrafast excited-state dynamics of RNA and DNA C tracts

Affiliations

Ultrafast excited-state dynamics of RNA and DNA C tracts

Boiko Cohen et al. Chem Phys. 2008 Jun.

Abstract

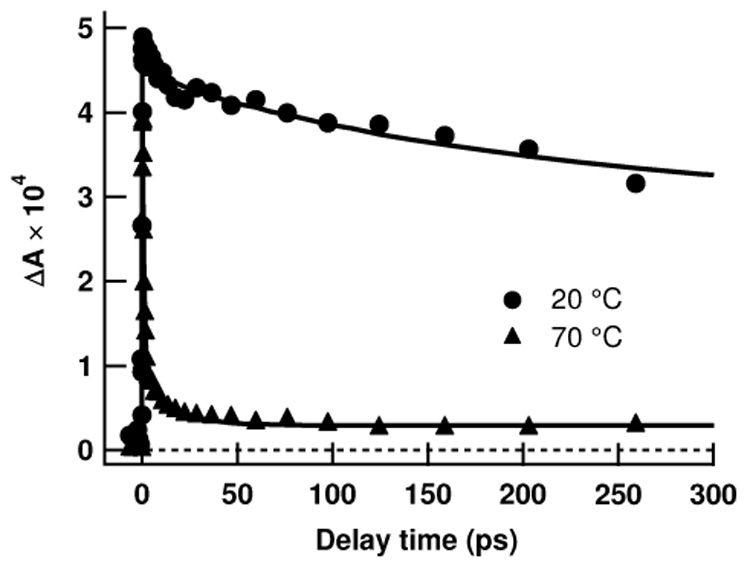
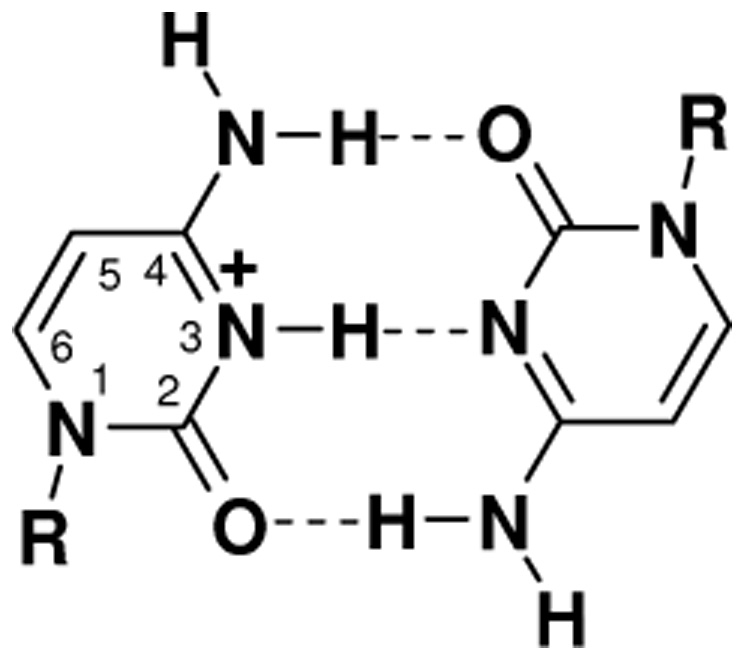
The excited-state dynamics of the RNA homopolymer of cytosine and of the 18-mer (dC)(18) were studied by steady-state and time-resolved absorption and emission spectroscopy. At pH 6.8, excitation of poly(rC) by a femtosecond UV pump pulse produces excited states that decay up to one order of magnitude more slowly than the excited states formed in the mononucleotide cytidine 5'-monophosphate under the same conditions. Even slower relaxation is observed for the hemiprotonated, self-associated form of poly(rC), which is stable at acidic pH. Transient absorption and time-resolved fluorescence signals for (dC)(18) at pH 6.8 are similar to ones observed for poly(rC) near pH 4, indicating that hemiprotonated structures are found in DNA C tracts at neutral pH. In both systems, there is evidence for two kinds of emitting states with lifetimes of ~100 ps and slightly more than 1 ns. The former states are responsible for the bulk of emission from the hemiprotonated structures. Evidence suggests that slow electronic relaxation in these self-complexes is the result of vertical base stacking. The similar signals from RNA and DNA C tracts suggest a common base-stacked structure, which may be identical with that of i-motif DNA.


Figures

Figure 1
Figure 1
Normalized absorption spectra of poly(rC) (circles) and CMP (squares) at (a) pH 6.8 and (b) pH 4. The wavelength of maximum absorption (λmax) is indicated by a vertical line. (c) Comparison of the pH 4 absorption spectrum of poly(rC) (circles) and (dC)18 at pH 6.8 (diamonds). The solid line is the emission spectrum of poly(rC) at pH 4 excited at 290 nm.
Figure 2
Figure 2
Circular dichroism spectrum of (dC)18 at pH 6.8 (solid curve) and pH 8.5 (dashed curve).
Figure 3
Figure 3
Transient absorption signals at 570 nm following excitation at 263 nm from poly(rC) (○) and CMP (□) in pH 6.8 buffer solution. Solid curves are least-squares fits described in the text. The signals were corrected for ionization of neat water using the procedure described in ref. [20]
Figure 4
Figure 4
Transient absorption from poly(rC) at pH 4 (circles) and (dC)18 at pH 6.8 (diamonds) at the indicated probe wavelengths after excitation at 263 nm. The solid line in the middle panel is a least squares-fit curve to guide the eye.
Figure 5
Figure 5
Transient absorption at 20° and 70°C from poly(rC) at (a) pH 6.8 and (b) pH 4. The pump wavelength was 263 nm and the probe wavelength was 570 nm.
Figure 5
Figure 5
Transient absorption at 20° and 70°C from poly(rC) at (a) pH 6.8 and (b) pH 4. The pump wavelength was 263 nm and the probe wavelength was 570 nm.
Figure 6
Figure 6
Transient absorption signals of (dC)18 at pH 6.8 and pH 8.5 pumped at 263 nm and probed at 570 nm.
Figure 7
Figure 7
Emission decays measured by TCSPC at 440 nm for poly(rC) at pH 5 (circles) and (dC)18 at pH 6.8 (squares). The instrument response function (FWHM of 46 ps) is shown by the solid black curve without markers. The dashed black curve is the 570 nm transient absorption signal of poly(rC) at pH 4. The inset shows all curves on a logarithmic axis.
Figure 8
Figure 8
(a) CH+·C base pair stacking in the Egli et al. (ref. [59]) crystal structure of a deoxycytidylyl-(3′–5′)-deoxycytidine analog containing intranucleosidyl C(3′)–C(5′) ethylene bridges, and (b) in the quadruplex (“i-motif”) crystal structure of Chen et al. (ref. [51]). Color scheme: hydrogen (white), nitrogen (blue), and oxygen (red). The three hydrogen bonds of the base pair on top (bottom) are shown in black (orange). The proton between the N3 atoms of each base pair has been omitted. These images were produced using the UCSF Chimera package (ref. [67]) from the Resource for Biocomputing, Visualization, and Informatics at the University of California, San Francisco (supported by NIH P41 RR-01081).
Scheme 1
Scheme 1
Hemiprotonated cytosine-cytosine base pair. R denotes ribose or 2’-deoxyribose.

References

    1. Callis PR. Ann. Rev. Phys. Chem. 1983;34:329.
    1. Crespo-Hernández CE, Cohen B, Hare PM, Kohler B. Chem. Rev. 2004;104:1977. - PubMed
    1. Pecourt J-ML, Peon J, Kohler B. J. Am. Chem. Soc. 2001;123:10370. - PubMed
    1. Peon J, Zewail AH. Chem. Phys. Lett. 2001;348:255.
    1. Onidas D, Markovitsi D, Marguet S, Sharonov A, Gustavsson T. J. Phys. Chem. B. 2002;106:11367.

LinkOut - more resources