. 2008 Jul;58(7):2019-29.
doi: 10.1002/art.23546.

Elucidating bone marrow edema and myelopoiesis in murine arthritis using contrast-enhanced magnetic resonance imaging

Affiliations

Elucidating bone marrow edema and myelopoiesis in murine arthritis using contrast-enhanced magnetic resonance imaging

Steven T Proulx et al. Arthritis Rheum. 2008 Jul.

Abstract

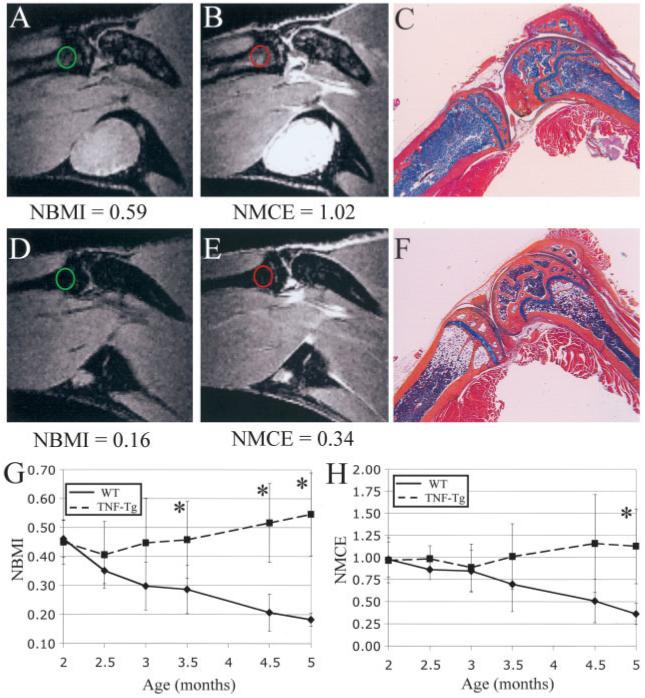
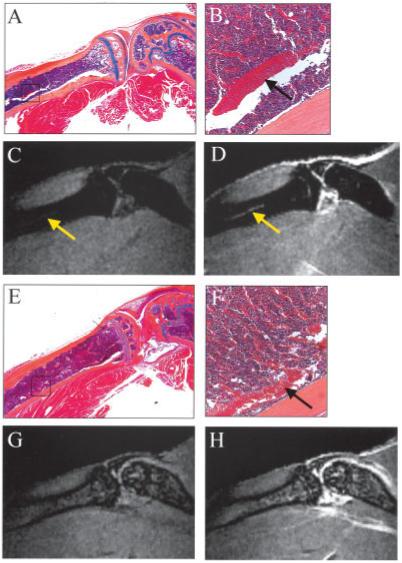
Objective: While bone marrow edema (BME) detected by magnetic resonance imaging (MRI) is a biomarker of arthritis, its nature remains poorly understood due to the limitations of clinical studies. In this study, MRI of murine arthritis was used to elucidate its cellular composition and vascular involvement.

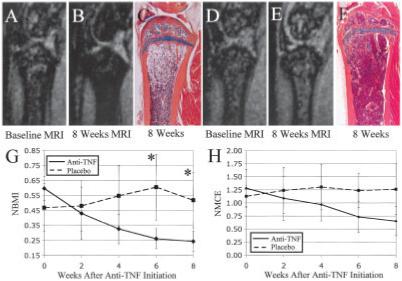
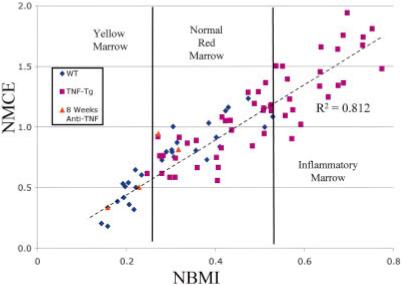
Methods: BME was quantified using normalized bone marrow intensity (NBMI) from precontrast MRI and normalized marrow contrast enhancement (NMCE) following intravenous administration of gadopentate dimeglumine. Wild-type (WT) and tumor necrosis factor (TNF)-transgenic mice were scanned from 2 to 5 months of age, followed by histologic or fluorescence-activated cell sorting (FACS) analysis of marrow. In efficacy studies, TNF-transgenic mice were treated with anti-TNF or placebo for 8 weeks, and then were studied using bimonthly MRI and histologic analysis.

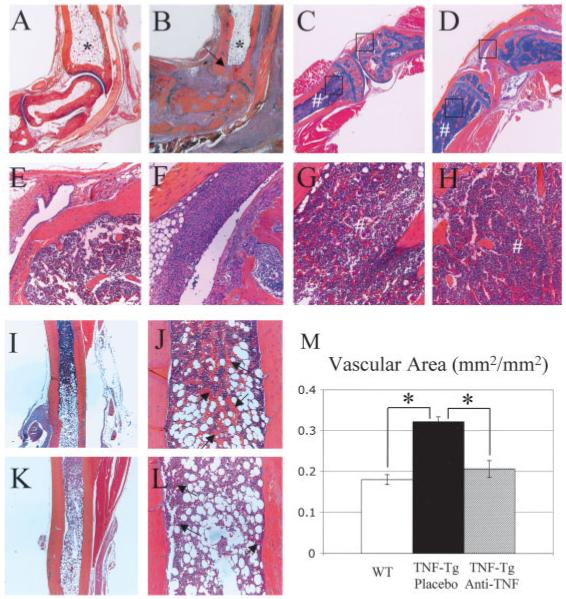
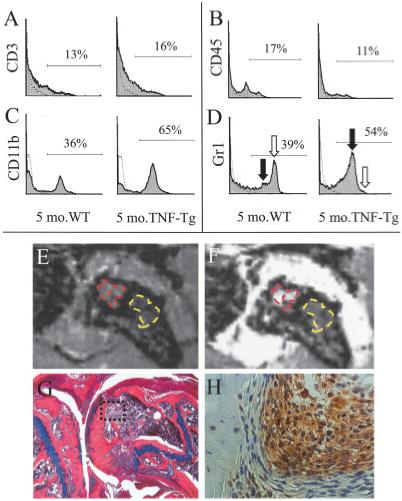
Results: NBMI values were similar in WT and TNF-transgenic mice at 2 months. The values in WT mice steadily decreased thereafter, with mean values becoming significantly different from those of TNF-transgenic mice at 3.5 months (mean +/- SD 0.29 +/- 0.08 versus 0.46 +/- 0.13; P < 0.05). Red to yellow marrow transformation occurred in WT but not TNF-transgenic mice, as observed histologically at 5 months. The marrow of TNF-transgenic mice that received anti-TNF therapy converted to yellow marrow, with lower NBMI values versus placebo at 6 weeks (mean +/- SD 0.26 +/- 0.07 versus 0.61 +/- 0.22; P < 0.05). FACS analysis of bone marrow revealed a significant correlation between NBMI values and CD11b+ monocytes (R2 = 0.91, P = 0.0028). Thresholds for "normal" red marrow versus pathologic BME were established, and it was also found that inflammatory marrow is highly permeable to contrast agent.

Conclusion: BME signals in TNF-transgenic mice are caused by yellow to red marrow conversion, with increased myelopoiesis and increased marrow permeability. The factors that mediate these changes warrant further investigation.


Figures

Figure 1
Figure 1
Differences in the bone marrow of tumor necrosis factor-transgenic (TNF-Tg) and wild-type (WT) mice. A-F, Magnetic resonance images and corresponding orange G-Alcian blue-stained histologic sections of the knee joints from representative 5-month-old TNF-Tg mice (A-C) and WT mice (D-F). Features of the mice have been described previously (20). Quantification of bone marrow edema showed that marrow from TNF-Tg mice was hyperintense on precontrast images (A) (circle), and was brighter after contrast enhancement (B) (circle); these findings correlated with high cellularity throughout the marrow seen on histologic examination (C). In contrast, bone marrow of WT mice was hypointense (D) (circle), and showed little enhancement after injection of gadopentate dimeglumine (E) (circle). This low signal intensity correlated with a yellow marrow phenotype seen on histologic analysis (F). (Original magnification × 4.) G and H, Longitudinal measurement of normalized bone marrow intensity (NBMI) (G) and normalized marrow contrast enhancement (NMCE) (H) in 2-5-month-old WT and TNF-Tg mice. There was a highly significant decline in both NBMI and NMCE in WT mice. In comparison, TNF-Tg mice showed significant increases in both NBMI and NMCE. Values are the mean ± SD. * = P < 0.05 versus WT mice.
Figure 2
Figure 2
Conversion of highly cellular marrow from TNF-Tg mice to yellow marrow with anti-TNF therapy. Magnetic resonance images (MRIs) of the proximal tibia were obtained at baseline (A and D) and 8 weeks after initiation of treatment (B and E) with anti-TNF (A and B) or placebo (D and E), as previously described (20). Anti-TNF therapy converted the highly cellular marrow to yellow marrow, as evidenced by hypointense marrow at 8 weeks (B) and highly fatty marrow in the corresponding histologic analysis performed after the mice were killed (C). Longitudinal quantification of the MRI signal in the marrow of these mice, using regression analysis, showed a highly significant decrease in NBMI (G) and NMCE (H) with therapy. In contrast, the marrow of placebo-treated mice remained hyperintense on MRI (E) and was highly cellular (F); quantification of the MRI signal in placebo-treated mice showed a significant increase in NBMI during the study (G). While significant differences in NBMI values were detected between the groups at 6 and 8 weeks (* = P < 0.05 versus WT mice), no significant differences in NMCE values were observed. Values in G and H are the mean ± SD. See Figure 1 for other definitions.
Figure 3
Figure 3
Lack of red to yellow marrow conversion in TNF-Tg mice is caused by systemic effects rather than local joint inflammation and is reversed along a distal to proximal axis by anti-TNF therapy. A-L, Orange G-Alcian blue-stained histologic sections from representative 5-month-old WT and TNF-Tg mice. The marrow in the distal tibiae of both WT (A) and TNF-Tg (B) mice was equally filled with adipose tissue (*), despite the severe inflammation of the joint and focal bone erosion of the tibia (arrow). In contrast, the proximal tibiae of 2 representative 5-month-old TNF-Tg mice (G and H) were filled with red marrow (#), irrespective of the absence (C and E) or presence (D and F) of adjacent synovitis and focal erosions; boxed areas at the top of C, bottom of C, top of D, and bottom of D are shown at higher magnification in E, G, F, and H, respectively. Magnetic resonance imaging of this region (not shown) corroborated the finding of hyperintense marrow in the tibial metaphysis of both TNF-Tg mice. Histologic analysis of the distal tibial diaphyses of TNF-Tg mice without treatment (I and J) and after 8 weeks of anti-TNF therapy (K and L) highlighted the marrow conversion front. Note the highly vascular region at the yellow-red marrow interface in untreated mice, as evidenced by the large number of erythrocytes (arrows in J), in contrast with their paucity at this interface in anti-TNF-treated mice (arrows in L). M, Quantification of the vascular area in the red marrow of the midtibial diaphyses of WT, placebo-treated TNF-Tg, and anti-TNF-treated TNF-Tg mice (n = 3 per group), determined by histomorphometry of erythrocytic regions with point counting, as described in Materials and Methods. Values are the mean ± SD. * = P < 0.01. (Original magnification × 4 in A-D, I, and K; × 20 in E-H, J, and L.) See Figure 1 for definitions.
Figure 4
Figure 4
Association of generalized bone marrow edema (BME) signals with increased myelopoiesis. A-D, Bone marrow cells harvested from 5-month-old WT and TNF-Tg mice were stained with labeled antibodies specific for CD3 (A), CD45 (B), CD11b (C), or Gr-1 (D), and analyzed by fluorescence-activated cell sorting. The histogram data from individual animals are representative of 3 independent experiments. Of note are the similar CD3+ and CD45+ cell frequencies in the marrow of WT and TNF-Tg mice, compared with the marked increase in the percentage of CD11b+ and Gr-1+ cells in TNF-Tg mice. Moreover, the increase in Gr-1+ cells is specifically in the Gr-1low monocyte population (solid arrow), with a concomitant decrease in the Gr-1high neutrophil population (open arrow). E-H, Magnetic resonance imaging (MRI) and histologic studies were performed in older (8-month-old) TNF-Tg mice with severe inflammatory erosive arthritis of the knee. Two distinct patterns of edema were seen, as evidenced by the representative findings shown. Precontrast MRIs (E) showed 2 hyperintense regions: subchondral (red) and in the femoral metaphysis (yellow). These regions were also apparent in the postcontrast image (F) (E and F are MRIs of the boxed area in G). In both cases, the mean signal intensity per pixel was markedly higher in the subchondral BME. The mouse was killed immediately after MRI scanning, and orange G-Alcian blue-stained histologic sections (G) revealed a cortical break in which synovial infiltrate from the pannus had penetrated into the subchondral marrow (original magnification × 10). Immunohistochemical analysis with antibodies specific for F4/80 revealed that the infiltrating cells adjacent to the subchondral osteoblasts were macrophages (H) (original magnification × 20). See Figure 1 for other definitions.
Figure 5
Figure 5
Association of bone marrow edema in TNF-Tg mice with increased permeability of the blood-bone marrow barrier. A and B, Orange G-Alcian blue-stained histologic section from a 5-month-old WT mouse highlights the nutrient artery in the tibia (boxed area in A and arrow in B). Boxed area in A is shown at higher magnification in B. C and D, Precontrast (C) and postcontrast (D) magnetic resonance images (MRIs) of this tibia obtained immediately before the mouse was killed depict the nutrient artery as a bright line that is differentiated from hypointense red marrow (arrows). E and F, A similar histologic section from a 5-month-old TNF-Tg mouse shows the same red marrow phenotype adjacent to the nutrient artery (arrow in F) as was seen in the WT mouse. Boxed area in E is shown at higher magnification in F. G and H, Precontrast (G) and postcontrast (H) MRIs in the same animal show a hyperintense diffuse marrow pattern in which the nutrient artery can no longer be distinguished, indicating that there is no intact barrier between marrow vascularity and the bone marrow space. (Original magnification × 10 in A; × 40 in E; × 20 in B and F.) See Figure 1 for other definitions.
Figure 6
Figure 6
Thresholds of yellow marrow, red marrow, and pathologic inflammatory bone marrow edema signals. Linear regression analysis of NBMI versus NMCE in the WT and TNF-Tg mice shown in Figure 1 and in anti-TNF-treated TNF-Tg mice after 8 weeks of therapy showed a highly significant association (R2 = 0.812, P < 0.0001), using Pearson’s correlation coefficient. Three groups of mice were differentiated in this plot. The first group was mice with yellow marrow and low values of both NBMI and NMCE. This group was composed exclusively of adult WT mice and 2 of the 4 anti-TNF-treated animals. The second group was mice with normal red marrow patterns and consisted of young WT mice, prearthritic TNF-Tg mice, and 2 of the 4 anti-TNF-treated mice. The third group contained only TNF-Tg mice with abnormal red marrow. See Figure 1 for definitions. Color figure can be viewed in the online issue, which is available at http://www.arthritisrheum.org.

References

    1. Feldmann M, Brennan FM, Maini RN. Rheumatoid arthritis. Cell. 1996;85:307–10. review. - PubMed
    1. Firestein GS. Evolving concepts of rheumatoid arthritis. Nature. 2003;423:356–61. review. - PubMed
    1. Feldmann M, Maini RN. TNF defined as a therapeutic target for rheumatoid arthritis and other autoimmune diseases. Nat Med. 2003;9:1245–50. published erratum appears in Nat Med 2003;9:1433. - PubMed
    1. McQueen FM, Ostendorf B. What is MRI bone oedema in rheumatoid arthritis and why does it matter? Arthritis Res Ther. 2006;8:222. review. - PMC - PubMed
    1. Appel H, Loddenkemper C, Grozdanovic Z, Ebhardt H, Dreimann M, Hempfing A, et al. Correlation of histopathological findings and magnetic resonance imaging in the spine of patients with ankylosing spondylitis. Arthritis Res Ther. 2006;8:R143. - PMC - PubMed

Publication types