

Advanced oxidation protein products activate vascular endothelial cells via a RAGE-mediated signaling pathway
- PMID: 18576917
- PMCID: PMC6464001
- DOI: 10.1089/ars.2007.1999
Advanced oxidation protein products activate vascular endothelial cells via a RAGE-mediated signaling pathway
Abstract
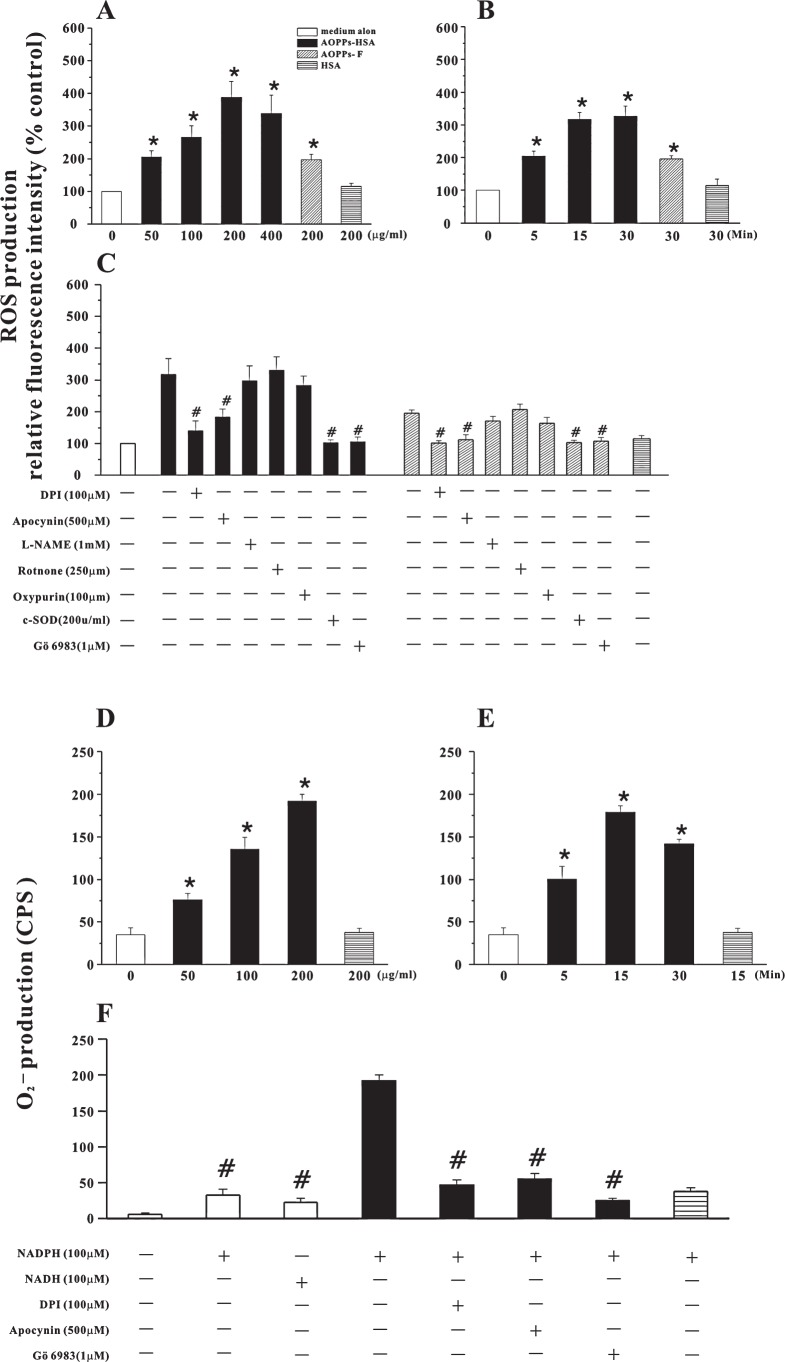
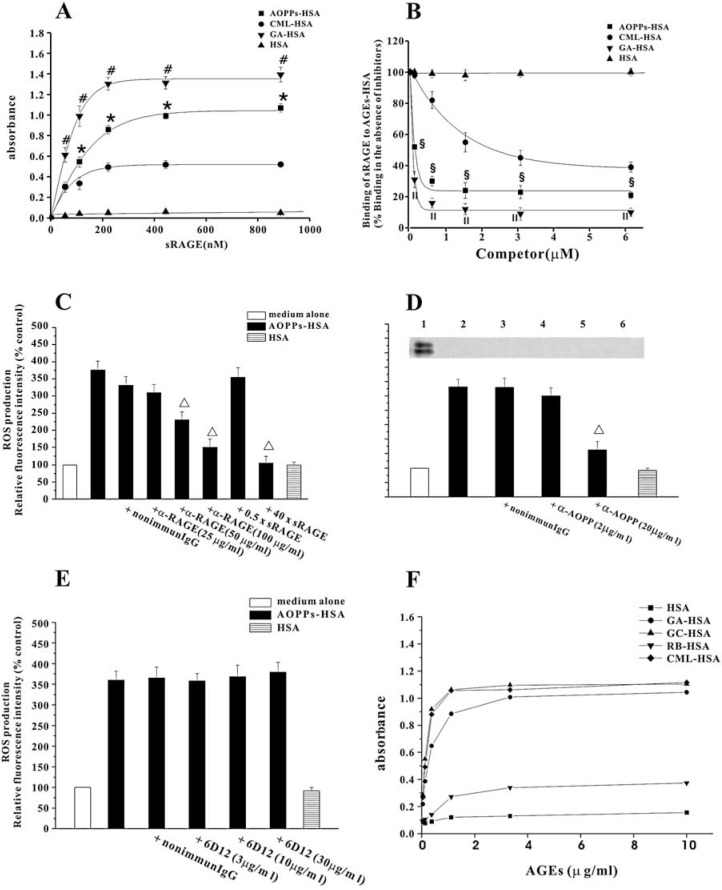
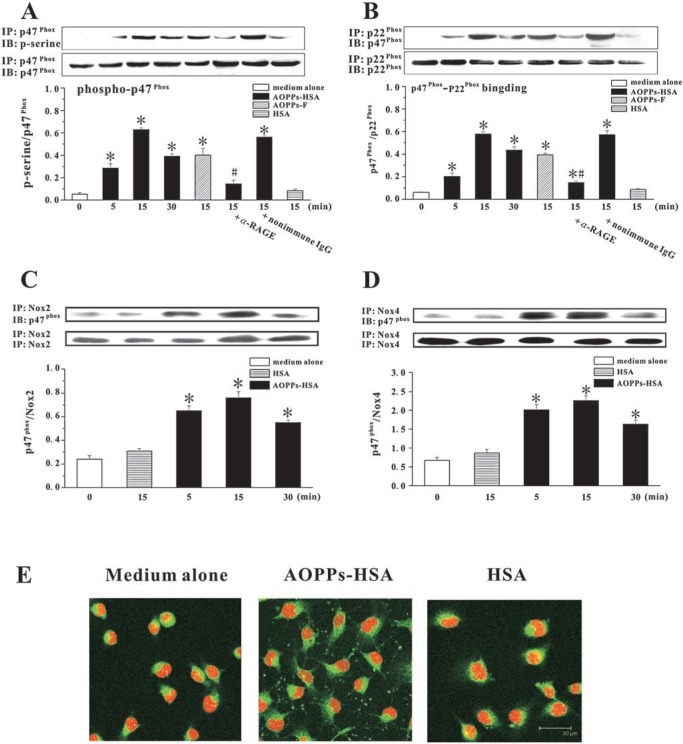
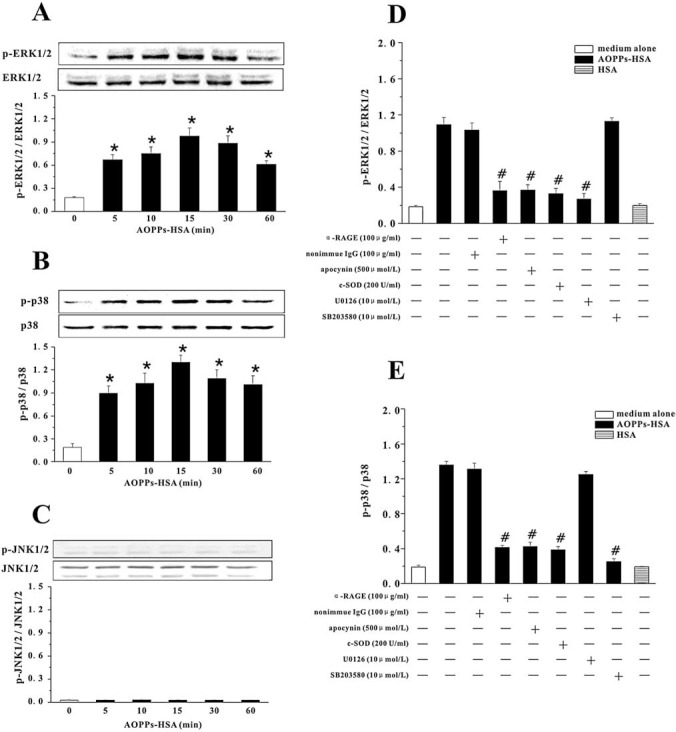
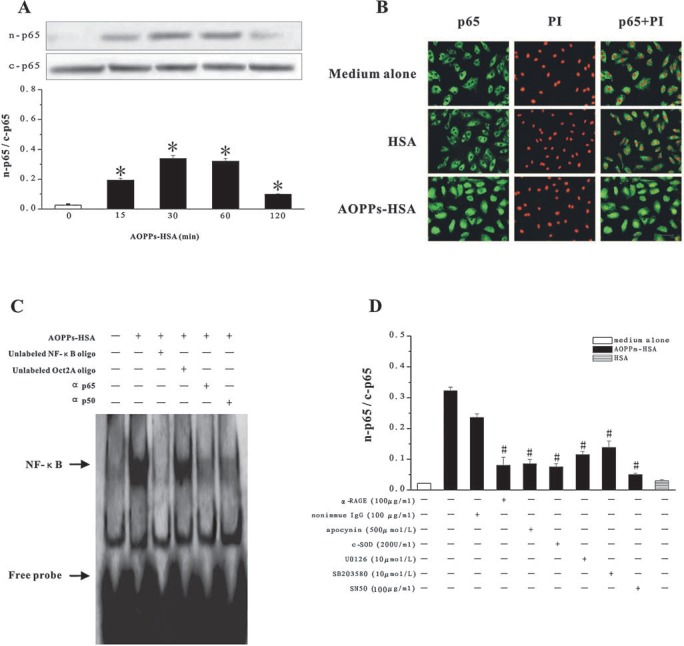
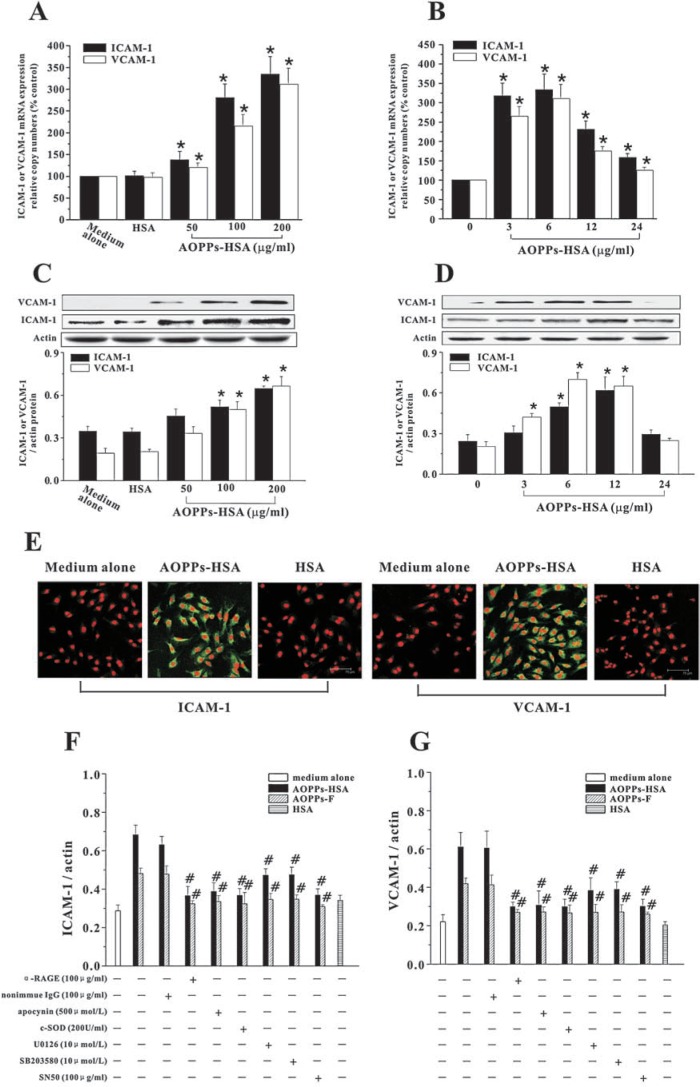
The accumulation of advanced oxidation protein products (AOPPs) has been linked to vascular lesions in diabetes, chronic renal insufficiency, and atherosclerosis. However, the signaling pathway involved in AOPPs-induced endothelial cells (ECs) perturbation is unknown and was investigated. AOPPs modified human serum albumin (AOPPs-HSA) bound to the receptor for advanced glycation end products (RAGE) in a dose-dependent and saturable manner. AOPPs-HSA competitively inhibited the binding of soluble RAGE (sRAGE) with its preferential ligands advanced glycation end products (AGEs). Incubation of AOPPs, either prepared in vitro or isolated from uremic serum, with human umbilical vein ECs induced superoxide generation, activation of NAD(P)H oxidase, ERK 1/2 and p38, and nuclear translocation of NF-kappaB. Activation of signaling pathway by AOPPs-ECs interaction resulted in overexpression of VCAM-1 and ICAM-1 at both gene and protein levels. This AOPPs-triggered biochemical cascade in ECs was prevented by blocking RAGE with either anti-RAGE IgG or excess sRAGE, but was not affected by the neutralizing anti-AGEs IgG. These data suggested that AOPPs might be new ligands of endothelial RAGE. AOPPs-HSA activates vascular ECs via RAGE-mediated signals.
Figures
Similar articles
-
Advanced glycation end products activate endothelium through signal-transduction receptor RAGE: a mechanism for amplification of inflammatory responses.Circulation. 2002 Feb 19;105(7):816-22. doi: 10.1161/hc0702.104183. Circulation. 2002. PMID: 11854121
-
Amadori-modified glycated albumin predominantly induces E-selectin expression on human umbilical vein endothelial cells through NADPH oxidase activation.Clin Chim Acta. 2006 May;367(1-2):137-43. doi: 10.1016/j.cca.2005.12.008. Epub 2006 Feb 7. Clin Chim Acta. 2006. PMID: 16455066
-
Advanced glycation end-products increase IL-6 and ICAM-1 expression via RAGE, MAPK and NF-κB pathways in human gingival fibroblasts.J Periodontal Res. 2018 Jun;53(3):334-344. doi: 10.1111/jre.12518. Epub 2017 Nov 30. J Periodontal Res. 2018. PMID: 29193068
-
Role of advanced glycation end products in cellular signaling.Redox Biol. 2014 Jan 9;2:411-29. doi: 10.1016/j.redox.2013.12.016. eCollection 2014. Redox Biol. 2014. PMID: 24624331 Free PMC article. Review.
-
RAGE: a novel cellular receptor for advanced glycation end products.Diabetes. 1996 Jul;45 Suppl 3:S77-80. doi: 10.2337/diab.45.3.s77. Diabetes. 1996. PMID: 8674899 Review.
Cited by
-
Sesquiterpene lactones inhibit advanced oxidation protein product-induced MCP-1 expression in podocytes via an IKK/NF-κB-dependent mechanism.Oxid Med Cell Longev. 2015;2015:934058. doi: 10.1155/2015/934058. Epub 2015 Jan 12. Oxid Med Cell Longev. 2015. PMID: 25664142 Free PMC article.
-
Oxidative stress and galactose-deficient IgA1 as markers of progression in IgA nephropathy.Clin J Am Soc Nephrol. 2011 Aug;6(8):1903-11. doi: 10.2215/CJN.11571210. Epub 2011 Jul 22. Clin J Am Soc Nephrol. 2011. PMID: 21784819 Free PMC article.
-
N-acetyl-cysteine inhibits liver oxidative stress markers in BALB/c mice infected with Leishmania amazonensis.Mem Inst Oswaldo Cruz. 2017 Feb;112(2):146-154. doi: 10.1590/0074-02760160403. Mem Inst Oswaldo Cruz. 2017. PMID: 28177049 Free PMC article.
-
Rap1a Regulates Cardiac Fibroblast Contraction of 3D Diabetic Collagen Matrices by Increased Activation of the AGE/RAGE Cascade.Cells. 2021 May 22;10(6):1286. doi: 10.3390/cells10061286. Cells. 2021. PMID: 34067282 Free PMC article.
-
Evaluation of the AGE/sRAGE Axis in Patients with Multiple Myeloma.Antioxidants (Basel). 2019 Mar 4;8(3):55. doi: 10.3390/antiox8030055. Antioxidants (Basel). 2019. PMID: 30836666 Free PMC article.
References
-
- Ago T, Kitazono T, Ooboshi H, Iyama T, Han YH, Takada J, Wakisaka M, Ibayashi S, Utsumi H, and Iida M. Nox4 as the major catalytic component of an endothelial NAD(P)H oxidase. Circulation 109: 227–233, 2004 - PubMed
-
- Atabek ME, Keskin M, Yazici C, Kendirci M, Hatipoglu N, Koklu E, and Kurtoglu S. Protein oxidation in obesity and insulin resistance. Eur J Pediatr 165: 753–756, 2006 - PubMed
-
- Bass DA, Parce JW, Dechatelet LR, Szejda P, Seeds MC, and Thomas M. Flow cytometric studies of oxidative product formation by neutrophils: a graded response to membrane stimulation. J Immunol 130: 1910–1917, 1983 - PubMed
-
- Basta G, Lazzerini G, Massaro M, Simoncini T, Tanganelli P, Fu C, Kislinger T, Stern DM, Schmidt AM, and De Caterina R. Advanced glycation end products activate endothelium through signal-transduction receptor RAGE: a mechanism for amplification of inflammatory responses. Circulation 105: 816–822, 2002 - PubMed
Publication types
MeSH terms
Substances
Grants and funding
LinkOut - more resources
Full Text Sources
Miscellaneous
