. 2008 Aug 22;283(34):23004-15.
doi: 10.1074/jbc.M804084200. Epub 2008 Jun 24.

p21 Ras/impedes mitogenic signal propagation regulates cytokine production and migration in CD4 T cells

Affiliations

p21 Ras/impedes mitogenic signal propagation regulates cytokine production and migration in CD4 T cells

Jan Czyzyk et al. J Biol Chem. .

Abstract

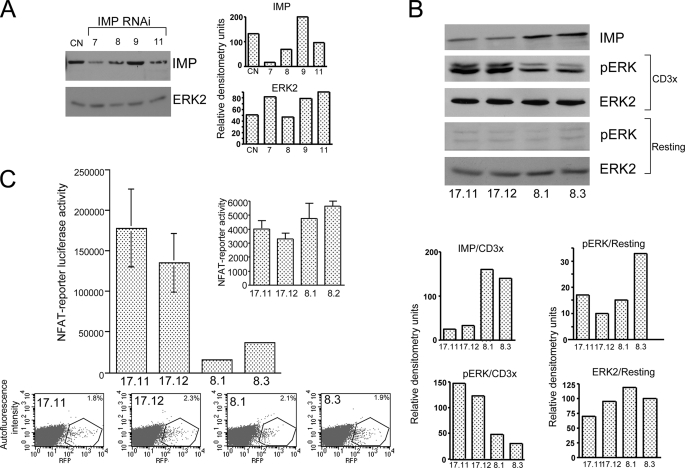
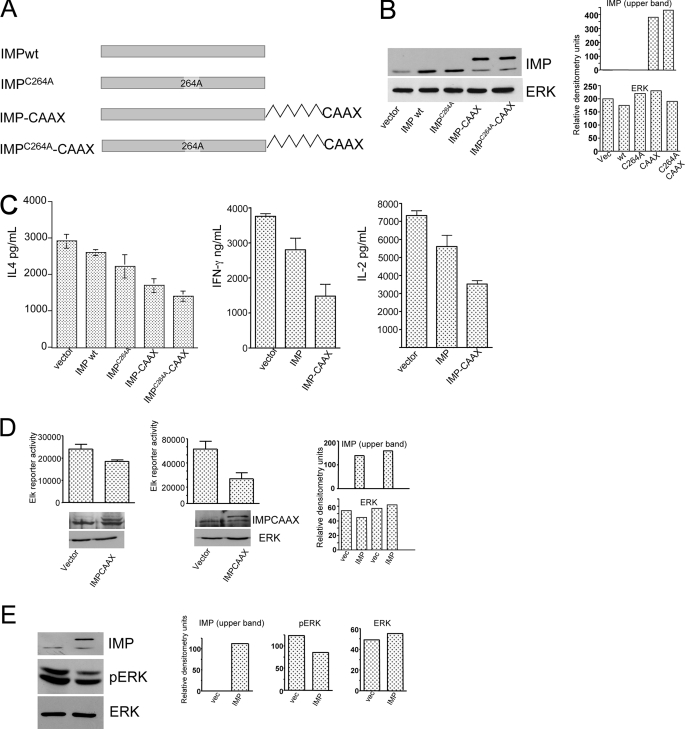
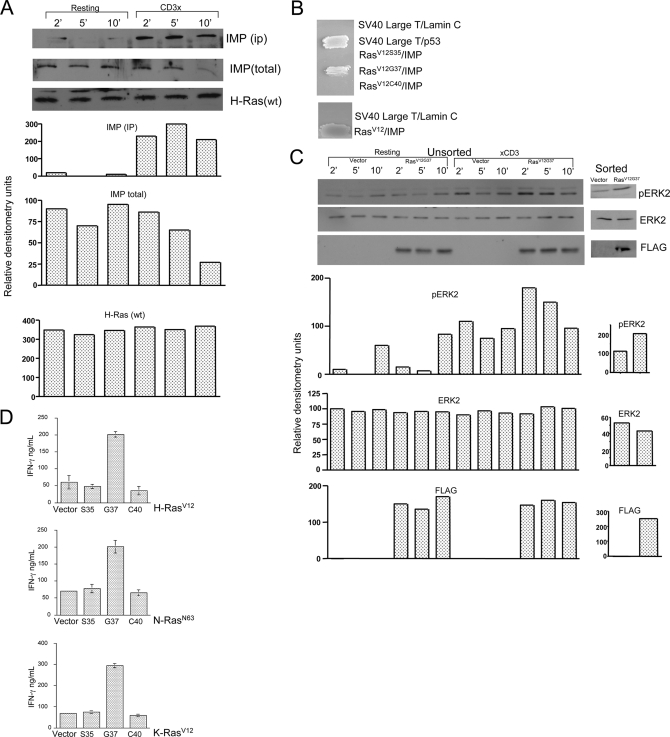
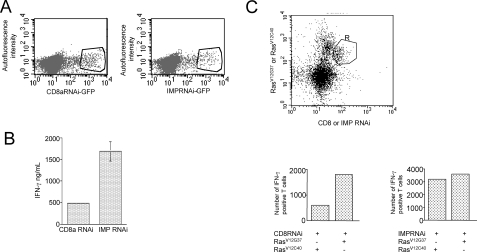
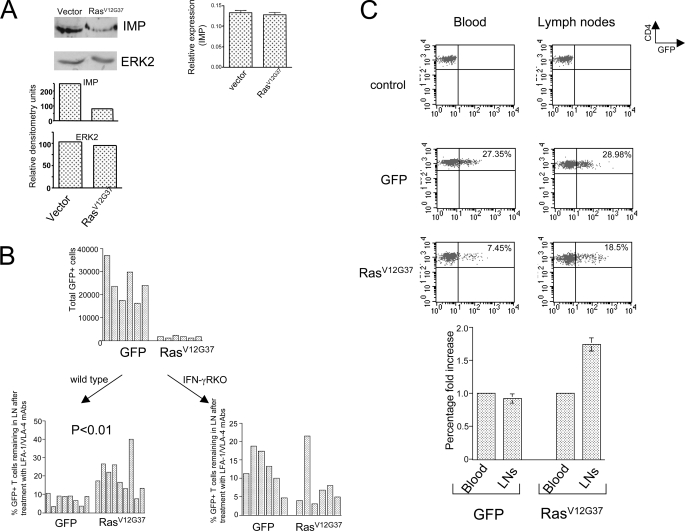
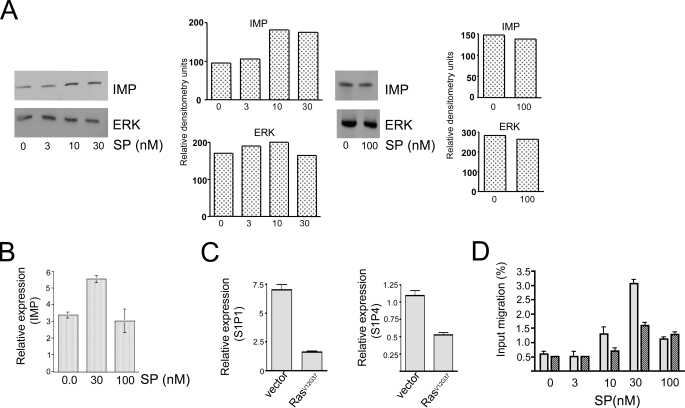
The propensity of T cells to generate coordinated cytokine responses is critical for the host to develop resistance to pathogens while maintaining the state of immunotolerance to self-antigens. The exact mechanisms responsible for preventing the overproduction of proinflammatory cytokines including interferon (IFN)-gamma are not fully understood, however. In this study, we examined the role of a recently described Ras GTPase effector and repressor of the Raf/MEK/ERK cascade called impedes mitogenic signal propagation (Imp) in limiting the induction of T-cell cytokines. We found that stimulation of the T cell receptor complex leads to the rapid development of a physical association between Ras and Imp. Consistent with the hypothesis that Imp inhibits signal transduction, we also found that disengagement of this molecule by the Ras(V12G37) effector loop mutant or RNA interference markedly enhances the activation of the NFAT transcription factor and IFN-gamma secretion. A strong output of IFN-gamma is responsible for the distinct lymphocyte traffic pattern observed in vivo because the transgenic or retroviral expression of Ras(V12G37) caused T cells to accumulate preferentially in the lymph nodes and delayed their escape from the lymphoid tissue, respectively. Together, our results describe a hitherto unrecognized negative regulatory role for Imp in the production of IFN-gamma in T cells and point to Ras-Imp binding as an attractive target for therapeutic interventions in conditions involving the production of this inflammatory cytokine.


Figures

FIGURE 1.
FIGURE 1.
Imp represses the transcriptional response in human T cells. A, Western blot analysis of Jurkat T cells expressing individual RNAi designed against human Imp. Jurkat T cells were transiently electroporated with individual RNAi subcloned into the pSilcencer™ 3.1-H1 hygro and pMSCV, which expresses GFP. After 48 h, the cells were sorted for GFP expression and then treated with the 1% Nonidet P-40 lysis buffer. The cell extracts were analyzed on Western blots using anti-Imp and anti-Erk2 antibodies (see “Experimental Procedures”). B, Western blot analysis of the Imp protein level and activated ERK in individual Jurkat T clones expressing Imp-specific RNAi (number 7) or control RNAi. After a resting period in RPMI1640 medium supplemented with 0.1% fetal calf serum, the cells were left unstimulated (resting) or stimulated with anti-CD3 mAb (CD3x) (1.0 μg/ml) followed by cross-linking with 100 μg/ml goat anti-rat secondary antibody (5 min at 37 °C). Next, equal numbers of cells were lysed and the materials collected were run on the 9% acrylamide gel and analyzed by Western blotting, as indicated. C, transactivation of the NFAT reporter in Jurkat T cells expressing reduced levels of Imp. Jurkat T cell clones stably expressing either Imp-specific RNAi number 7 (clones 17.11 and 17.12) or CD8-specific RNAi (8.1 and 8.3 controls) were transfected with NFAT-luciferase reporter (top) and red fluorescent protein (RFP) to measure transfection efficiency by FACS (x axis, expression level of red fluorescent protein; y axis, autofluorescence intensity, bottom). After 48 h the cells were stimulated for an additional 18 h with the plate-bound anti-CD3 mAb (1 μg/ml) or left unstimulated (inset), harvested, and analyzed using the dual-luciferase reporter assay system (36). One representative of three experiments is shown (the data are expressed as mean ± S.D. of triplicate cultures (S.D. values for 17.11, 17.12, 8.1, and 8.2 cells are 48,386, 36,608, 1,785, and 2,024, respectively).
FIGURE 2.
FIGURE 2.
Imp inhibits cytokine output and ERK activation in primary CD4 T cells. A, schematic display of Imp variants. In the ImpC264A mutant the first cysteine in the RING-H2 motif has been replaced by alanine. The Imp-CAAX variant contains a stretch of 19 C-terminal residues of K-Ras4B, as described (30). B, Western blot verification of Imp expression in T cells transduced with single variants of Imp. Aliquots of GFP-positive CD4 T cells were sorted as in C and analyzed on Western blots with anti-Imp and anti-ERK2 antibodies. C, ELISA of IL-4 (left), IFN-γ (middle), and IL-2 (right) cytokine production in CD4 T cells expressing single variants of Imp. CD4 T cells were isolated from AND TCR transgenic B10.5R mice and stimulated with 5R APCs and 15 μg/ml of pMCC K99R peptide for 48 h. The cells were spin infected with individual Imp constructs or an empty vector (control) in that order, as indicated. Three days after the infection, GFP-positive CD4 T cells were sorted and restimulated with the same combination of APCs and the peptide that was used during the priming phase. After 24 h, the cell culture supernatants were harvested and analyzed for the presence of cytokines. The data are expressed as mean ± S.D. of triplicate cultures. One representative of three experiments is shown. D, transactivation of the Elk luciferase reporter in Jurkat T cells transfected with Imp-CAAX. 8.1 (left panel) and 17.11 (right panel) Jurkat T cells were electroporated using the Elk-1 PathDetect transreporting system (see “Experimental Procedures”), pRL-CMV as an internal control, and either an RNAi-resistant form of Imp-CAAX (right bar in each panel) or an empty vector (left bar in each panel). After 48 h, the cells were stimulated with plate-bound anti-CD3 mAb (0.75 μg/ml), harvested, and analyzed for luciferase activity, as described in A. To normalize the data, Renilla luciferase activity was measured in unstimulated cells. The data are expressed as mean ± S.D. One representative of three experiments is shown. E, Western blot analysis of activated ERK in CD4 T cells transduced with ImpC264A-CAAX. Sorted GFP-positive CD4 T cells carrying either ImpC264A-CAAX or an empty vector (control) were processed to obtain cell extracts and analyzed by staining Western blots with anti-p-ERK and anti-Imp antibodies.
FIGURE 3.
FIGURE 3.
Ras-mediated repression of Imp contributes to ERK activation and increased IFN-γ output in CD4 T cells. A, Imp Western blot analysis of anti-H-Ras immunoprecipitates. CD4 T cells isolated from AND TCR B10.BR mice and transduced with wild type FLAG-Ras in pMSCV were sorted for GFP expression. Following an 8-h resting period in 0.5% fetal calf serum, the cells were incubated on ice for 30 min with 1.0 μg/ml of anti-CD3 mAb (clone C363.29B) or left alone and then treated for 2, 5, and 10 min at 37 °C with 100 μg/ml of goat anti-rat secondary antibody. Next, the cells were lysed and Ras-associated Imp was isolated by incubation of the lysates with protein A-bound anti-FLAG antibody. The materials collected were run on the 9% acrylamide gel and analyzed by Western blotting for the levels of FLAG-Ras, associated Imp, and total Imp. B, yeast two-hybrid analysis of the association between H-RasV12 effector loop mutants and a region of Imp encompassing amino acid residues 273 to 377 (see “Experimental Procedures”). Cotransformants were patched onto plates lacking Trp, Leu, His, and Ade. Streaks of the colonies carrying SV40 large T and p53, or SV40 large T and laminin were included in the assay as positive and negative controls, respectively. C, Western blot analysis of activated ERK in CD4 T cells transduced with RasV12G37. Sorted (right) or unsorted (∼15% GFP-positive cells, left) AND TCR CD4 T cells that expressed either GFP alone or RasV12G37 were rested for 8 h in 0.5% fetal calf serum. The cells were then stimulated with anti-CD3 mAb, as described in A, and then analyzed by Western blotting for the presence of phosphorylated ERK, total ERK, and FLAG-RasV12G37. D, RasV12G37 selectively augments the production of IFN-γ in CD4 T cells. AND TCR-transgenic CD4 T cells were stimulated with pMCC (5μg/ml)-loaded APCs and then transduced with effector loop mutants (Ser35, Gly37, or Cys40) of H-(top), N-(middle), and K-Ras (low), as indicated. At 72 h posttransduction, the cells were sorted for GFP fluorescence, then restimulated with pMCC/APCs and finally analyzed for IFN-γ secretion by ELISA (plotted as mean ± S.D.).
FIGURE 4.
FIGURE 4.
Imp is positioned downstream of Ras in the regulation of IFN-γ response. A, FACS analysis of AND TCR CD4 T cells lentivirally transduced with CD8a-(left) or Imp-(right) specific RNAi. The cells were stimulated with APCs and pMCC (5 μg/ml) for 48 h and then spin-infected with lentiviral preps. After an additional incubation period (96 h), GFP-positive T cells were sorted and used for further analysis as depicted in B and C. B, analysis of IFN-γ secretion in CD4 T cells transduced with Imp RNAi. CD4 T cells expressing CD8- or Imp-specific RNAi were sorted for GFP expression and restimulated for 24 h with APCs plus pMCC (5 μg/ml). After restimulation, the culture supernatants were harvested from triplicate cultures and analyzed by ELISA. One representative of three experiments is shown. C, FACS analysis of intracellular IFN-γ in CD4 T cells transduced with RasV12G37 and Imp-specific RNAi. Top, AND TCR CD4 T cells lentivirally transduced with CD8 or Imp RNAi were restimulated with pMCC and APCs for 48 h and then transduced a second time with RasV12G37 or RasV12C40 (control) in a pMIGR2 retroviral plasmid in which human tailless CD2 has replaced GFP. After an additional 48-h rest, the cells were rested and briefly stimulated again as described under “Experimental Procedures.” Finally, the cells were stained for the extracellular portion of human CD2 and intracellular accumulation of IFN-γ. The cells that were positive for both GFP and Ras construct (e.g. CD8RNAi/RasV12G37, CD8RNAi/RasV12C40, ImpRNAi/RasV12G37 and ImpRNAi/RasV12C40) were gated (R) and analyzed for IFN-γ-production (bottom). The data are expressed as total number of cells that stained positive for intracellular expression of IFN-γ. One representative of three experiments is shown.
FIGURE 5.
FIGURE 5.
Ras/Imp signaling pathway regulates in vivo traffic of CD4 T cells. A, Western blot analysis of Imp in T cells with RasV12G37. CD4 T cells isolated from the spleens of mice expressing either inducible RasV12G37-IRES-GFP or GFP (vector) were processed to obtain cell extracts and analyzed by RT-PCR (right panel) or staining Western blots with anti-Imp and anti-Erk (control) antibodies (left panel). One representative of three experiments is shown. B, top, analysis of the distribution of GFP-positive, RasV12G37-positive CD4 T cells, and GFP-positive CD4 T cells (controls) in recipient mice after adoptive transfer. B6 mice were injected with aliquots containing 5 × 10⁶ CD4 T cells of which ∼25% cells were transduced with either RasV12G37 or GFP alone. Then 48 h after adoptive transfer, the animals were sacrificed and their inguinal lymph nodes were analyzed for the total cell number and percentage of GFP-positive CD4 T cells. Bottom, analysis of egress of RasV12G37 + CD4 T cells from the lymph nodes. Wild-type (left) or IFN-γR knock-out (right) B6 recipient mice were treated as described in the top part, or in addition received an intraperitoneal injection of phosphate-buffered saline or 100 μg of LFA-1 and VLA-4 mAbs 48 h after the adoptive transfer, as described previously (35). After an additional 15 h, the mice were sacrificed and their inguinal lymph nodes were processed as described above. The data are expressed as percentages of an average GFP- or RasV12G37-IRES-GFP-positive CD4 T cell count in mice that received phosphate-buffered saline. Each bar represents a single animal. C, top, FACS analysis of CD4 T cells isolated from transgenic mice expressing inducible RasV12G37. Wild-type mice (upper) and transgenic mice expressing either GFP alone (middle) or RasV12G37 GFP (lower) were subjected to a doxocycline diet for 2 weeks and sacrificed for an analysis of GFP-positive CD4 T cells isolated from their inguinal lymph nodes (right) and peripheral blood (left). Bottom, the average fold change of the percentage of GFP-positive CD4 T cells in the lymph nodes (LNs) compared with the peripheral blood. The mean ± S.D. are shown (n = 3).
FIGURE 6.
FIGURE 6.
Imp signaling opposes T cell migration induced by sphingosine phosphate. A, Western blot, and B, reverse transcriptase-PCR analyses of Imp induction by sphingosine phosphate. CD62hi-CD44lo CD4 T cells were isolated from 6-week-old B10BR mice and cultured for 24 h in the presence of increasing concentrations of sphingosine phosphate, as indicated. PCR data are expressed as mean ± S.D. The analyses were performed exactly as described under “Experimental Procedures.” One representative of three experiments is shown. C, reverse transcriptase-PCR analysis of S1P1 (left) and S1P4 (right) in CD4 T cells transduced with empty vector or RasV12G37. The cells were sorted for GFP expression at 96 h after spin infection and immediately used for the analysis. The data are expressed as mean ± S.D. D, analysis of chemotactic response of CD4 T cells to SP. Following treatment of transgenic mice with a doxocycline diet for 2 weeks, RasV12G37-positive (dark) or wild type (light) CD4 T cells were isolated from mice and used in a Transwell migration assay exactly as described under “Experimental Procedures.” The data are expressed as mean ± S.D. One representative of 3 experiments is shown.

Similar articles

Cited by

References

    1. Stokoe, D., MacDonald, S. G., Cadwallader, K., Symons, M., and Hancock, J. F. (1994) Science 264 1463–1467 - PubMed
    1. Vojtek, A. B., Hollenberg, S. M., and Cooper, J. A. (1993) Cell 74 205–214 - PubMed
    1. Downward, J., Graves, J. D., Warne, P. H., Rayter, S., and Cantrell, D. A. (1990) Nature 346 719–723 - PubMed
    1. Franklin, R. A., Tordai, A., Patel, H., Gardner, A. M., Johnson, G. L., and Gelfand, E. W. (1994) J. Clin. Investig. 93 2134–2140 - PMC - PubMed
    1. Stefanova, I., Hemmer, B., Vergelli, M., Martin, R., Biddison, W. E., and Germain, R. N. (2003) Nat. Immunol. 4 248–254 - PubMed

Publication types