

Japanese haemodialysis anaemia management practices and outcomes (1999-2006): results from the DOPPS
- PMID: 18577535
- PMCID: PMC2568010
- DOI: 10.1093/ndt/gfn346
Japanese haemodialysis anaemia management practices and outcomes (1999-2006): results from the DOPPS
Abstract
Background: Japanese haemodialysis (HD) patients not only have a very low mortality and hospitalization risk but also low haemoglobin (Hb) levels. Internationally, anaemia is associated with mortality, hospitalization and health-related quality of life (QoL) measures of HD patients.
Methods: Longitudinal data collected from 1999 to 2006 from 60 to 64 representative Japanese dialysis units participating in the Dialysis Outcomes and Practice Patterns Study (DOPPS) were used to describe anaemia management practices and outcomes for Japanese HD patients.
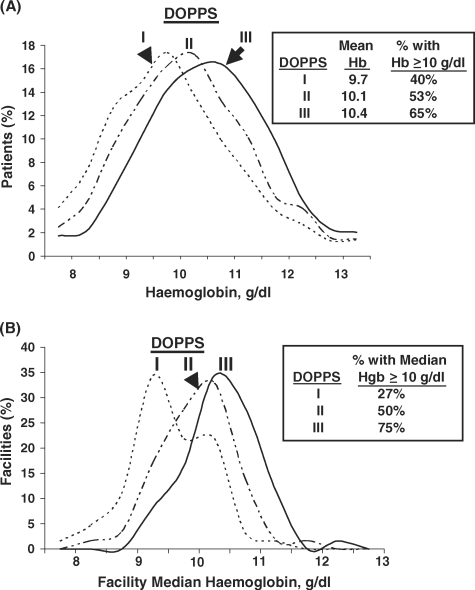
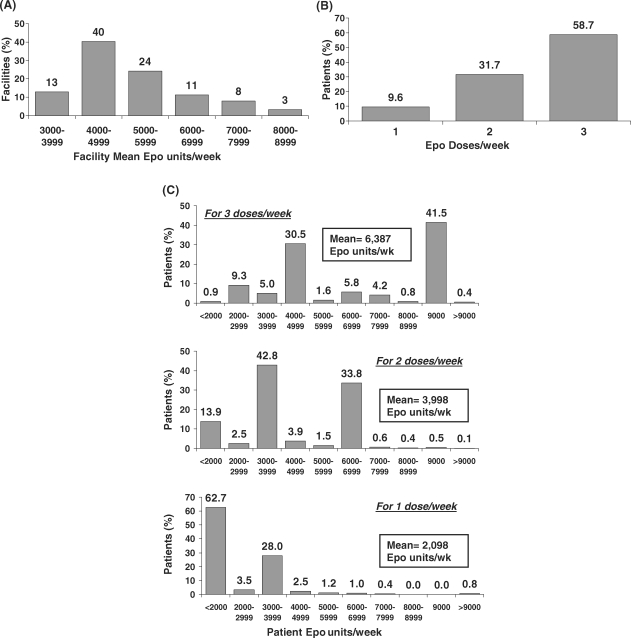
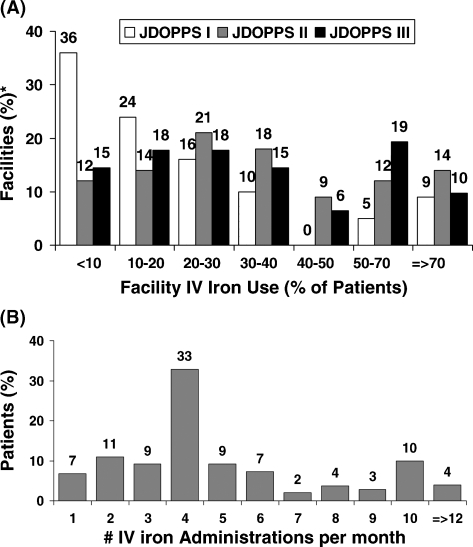
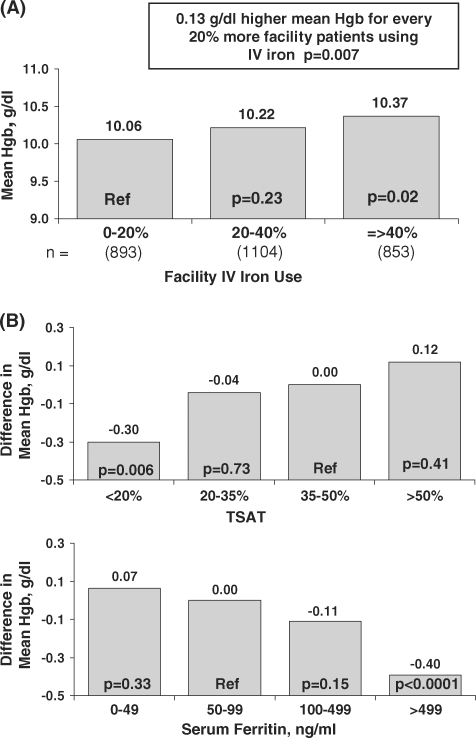
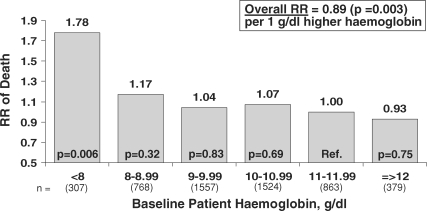
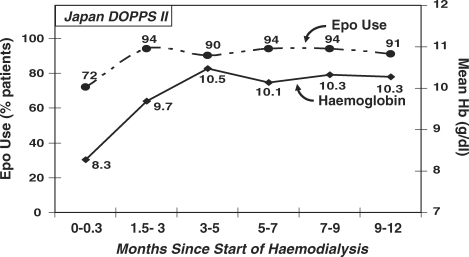
Results: From 1999 to 2006, patient mean Hb increased from 9.7 g/dl to 10.4 g/dl, and the percentage of facilities with median Hb >or=10 g/dl increased from 27% to 75%. Hb was measured in the supine position for 90% of patients, resulting in substantially lower reported Hb values than those seen in other countries. As of 2006, erythropoietin (Epo) was prescribed to 83% of HD patients; mean Epo dose was 5231 units/week; intravenous (IV) iron use was 33% and median IV iron dose was 160 mg/month. Many patient- and facility-level factors were significantly related to higher Hb. A consistent overall pattern of lower mortality risk with higher baseline Hb levels was seen (RR = 0.89 per 1 g/dl higher Hb, P = 0.003). Facilities with median Hb >or=10.4 displayed a lower mortality risk (RR = 0.77, P = 0.03) versus facility median Hb <10.4 g/dl. Lower Hb levels were not significantly related to hospitalization risk, but were associated with lower QoL scores.
Conclusions: These results provide detailed information on anaemia management practices in Japan and the relationships of anaemia control with outcomes, with implications of anaemia management worldwide.
Figures
Similar articles
-
Anemia management and outcomes from 12 countries in the Dialysis Outcomes and Practice Patterns Study (DOPPS).Am J Kidney Dis. 2004 Jul;44(1):94-111. doi: 10.1053/j.ajkd.2004.03.023. Am J Kidney Dis. 2004. PMID: 15211443
-
2008 Japanese Society for Dialysis Therapy: guidelines for renal anemia in chronic kidney disease.Ther Apher Dial. 2010 Jun;14(3):240-75. doi: 10.1111/j.1744-9987.2010.00836.x. Ther Apher Dial. 2010. PMID: 20609178
-
Anaemia in haemodialysis patients of five European countries: association with morbidity and mortality in the Dialysis Outcomes and Practice Patterns Study (DOPPS).Nephrol Dial Transplant. 2004 Jan;19(1):121-32. doi: 10.1093/ndt/gfg458. Nephrol Dial Transplant. 2004. PMID: 14671047
-
Mineral metabolism and haemoglobin concentration among haemodialysis patients in the Dialysis Outcomes and Practice Patterns Study (DOPPS).Nephrol Dial Transplant. 2005 May;20(5):927-35. doi: 10.1093/ndt/gfh732. Epub 2005 Feb 22. Nephrol Dial Transplant. 2005. PMID: 15728270
-
A rationale for an individualized haemoglobin target.Nephrol Dial Transplant. 2002;17 Suppl 6:2-7. doi: 10.1093/ndt/17.suppl_6.2. Nephrol Dial Transplant. 2002. PMID: 12091594 Review.
Cited by
-
Effect of achieved hemoglobin level on renal outcome in non-dialysis chronic kidney disease (CKD) patients receiving epoetin beta pegol: MIRcerA CLinical Evidence on Renal Survival in CKD patients with renal anemia (MIRACLE-CKD Study).Clin Exp Nephrol. 2019 Mar;23(3):349-361. doi: 10.1007/s10157-018-1649-0. Epub 2018 Oct 5. Clin Exp Nephrol. 2019. PMID: 30291472 Free PMC article.
-
Assessment of ocular microcirculation in patients with end-stage kidney disease.Graefes Arch Clin Exp Ophthalmol. 2018 Dec;256(12):2335-2340. doi: 10.1007/s00417-018-4137-z. Epub 2018 Sep 10. Graefes Arch Clin Exp Ophthalmol. 2018. PMID: 30203105
-
Use of agents stimulating erythropoiesis in digestive diseases.World J Gastroenterol. 2009 Oct 7;15(37):4675-85. doi: 10.3748/wjg.15.4675. World J Gastroenterol. 2009. PMID: 19787831 Free PMC article. Review.
-
The Impact of CKD Anaemia on Patients: Incidence, Risk Factors, and Clinical Outcomes-A Systematic Literature Review.Int J Nephrol. 2020 Jul 1;2020:7692376. doi: 10.1155/2020/7692376. eCollection 2020. Int J Nephrol. 2020. PMID: 32665863 Free PMC article.
-
Effect of statin on life prognosis in Japanese patients undergoing hemodialysis.PLoS One. 2019 Oct 22;14(10):e0224111. doi: 10.1371/journal.pone.0224111. eCollection 2019. PLoS One. 2019. PMID: 31639169 Free PMC article.
References
-
- Patient Registration Committee, Japanese Society for Dialysis Therapy An overview of regular dialysis treatment in Japan as of 31 December 2004. Ther Apher Dial. 2006;10:476–497. - PubMed
-
- Goodkin DA, Bragg-Gresham JL, Koenig KG, et al. Association of comorbid conditions and mortality in hemodialysis patients in Europe, Japan, and the United States: the Dialysis Outcomes and Practice Patterns Study (DOPPS) J Am Soc Nephrol. 2003;14:3270–3277. - PubMed
-
- Held PJ, Brunner F, Odaka M, et al. Five-year survival for end-stage renal disease patients in the United States, Europe, and Japan, 1982–1987. Am J Kidney Dis. 1990;15:451–457. - PubMed
-
- Valderrabano F. Renal replacement therapy. What are the differences between Japan and Europe? Nephrol Dial Transplant. 1996;11:2151–2153. - PubMed
-
- Saran R, Bragg-Gresham J, Levin NW, et al. Longer treatment time and slower ultrafiltration in hemodialysis: associations with reduced mortality in the DOPPS. Kidney Int. 2006;69:1222–1228. - PubMed
Publication types
MeSH terms
Substances
LinkOut - more resources
Full Text Sources
Medical
Research Materials
