. 2008 Jul 15;121(Pt 14):2360-71.
doi: 10.1242/jcs.014977. Epub 2008 Jun 24.

Caveolin-1-dependent beta1 integrin endocytosis is a critical regulator of fibronectin turnover

Affiliations

Caveolin-1-dependent beta1 integrin endocytosis is a critical regulator of fibronectin turnover

Feng Shi et al. J Cell Sci. .

Abstract

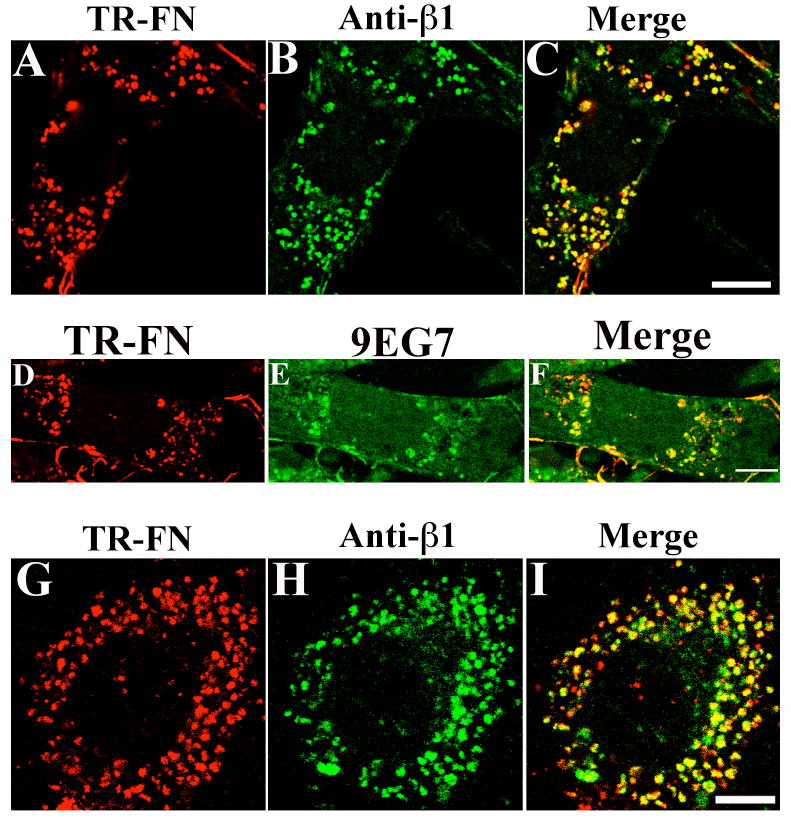
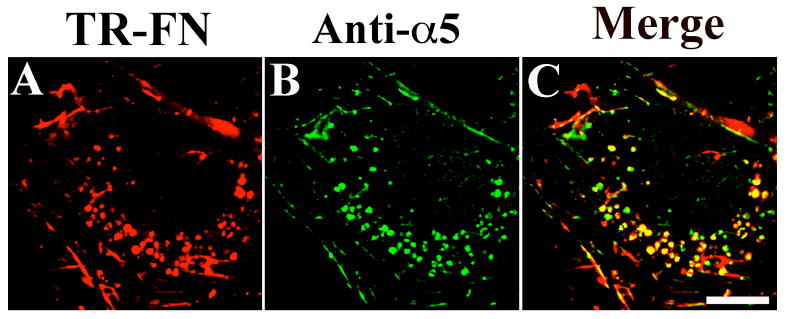
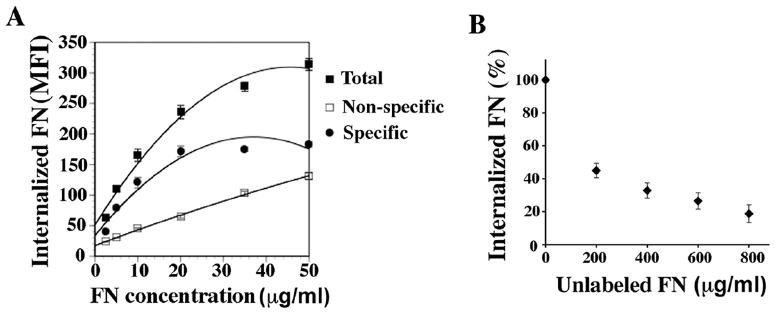
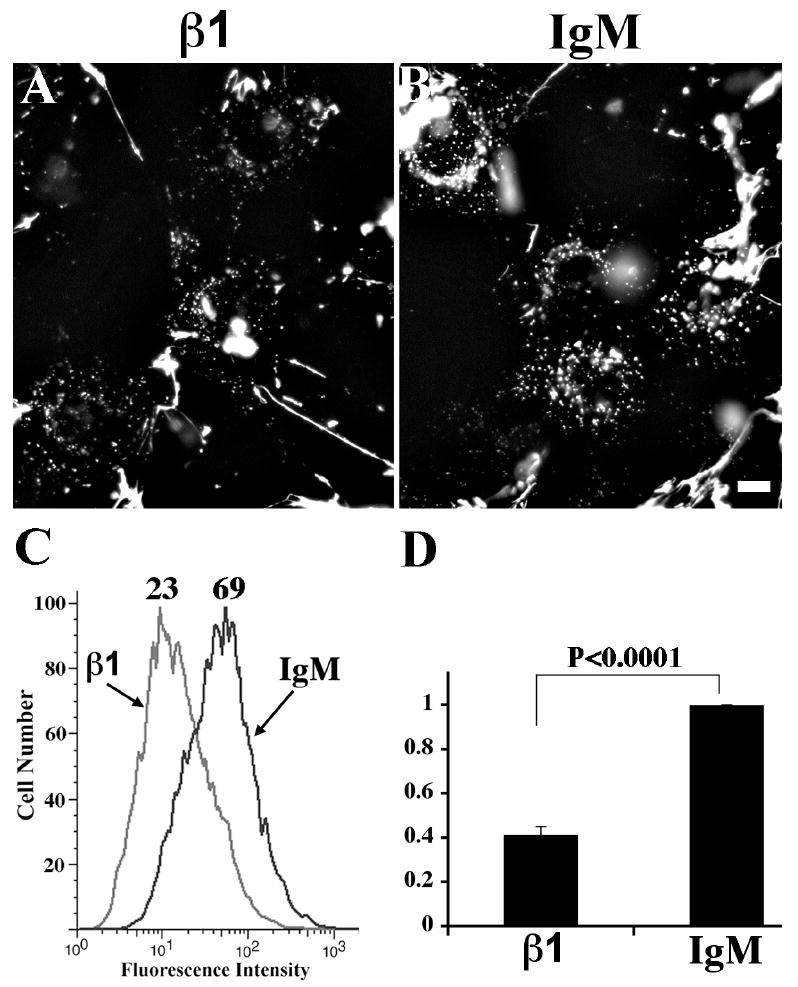
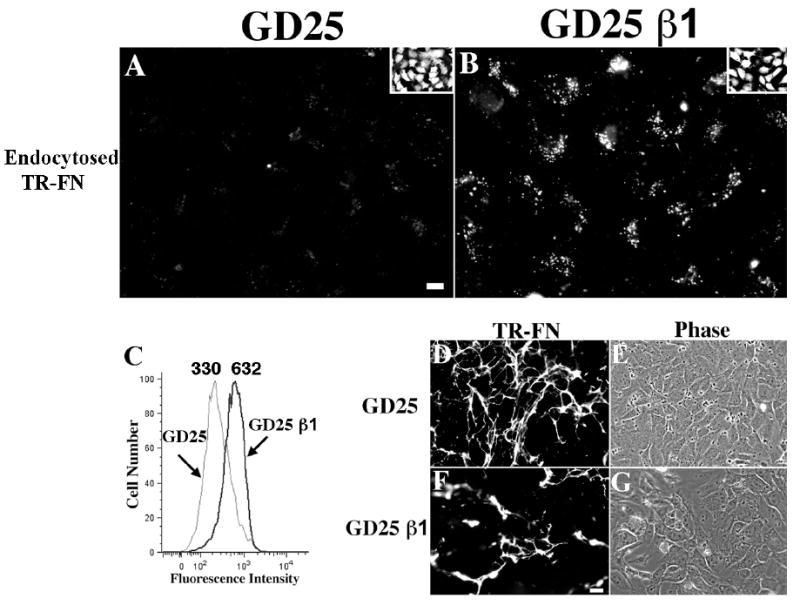
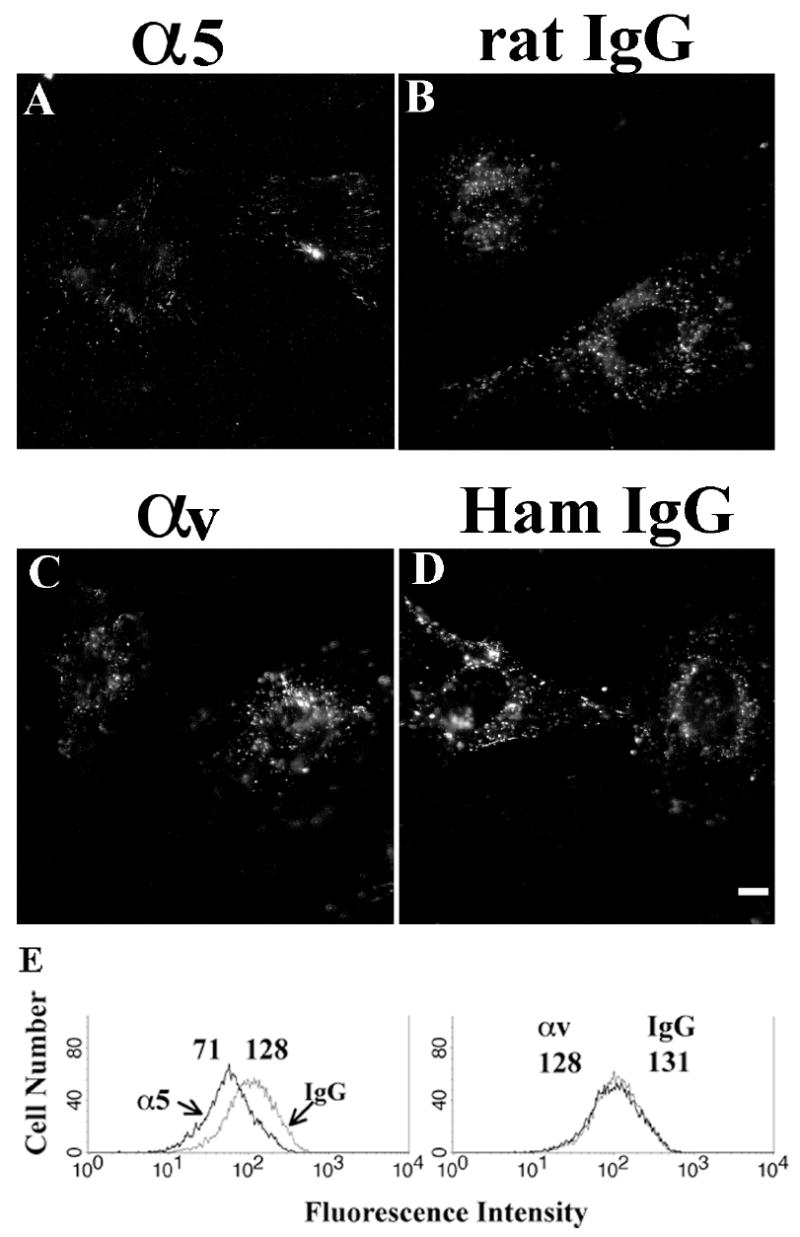
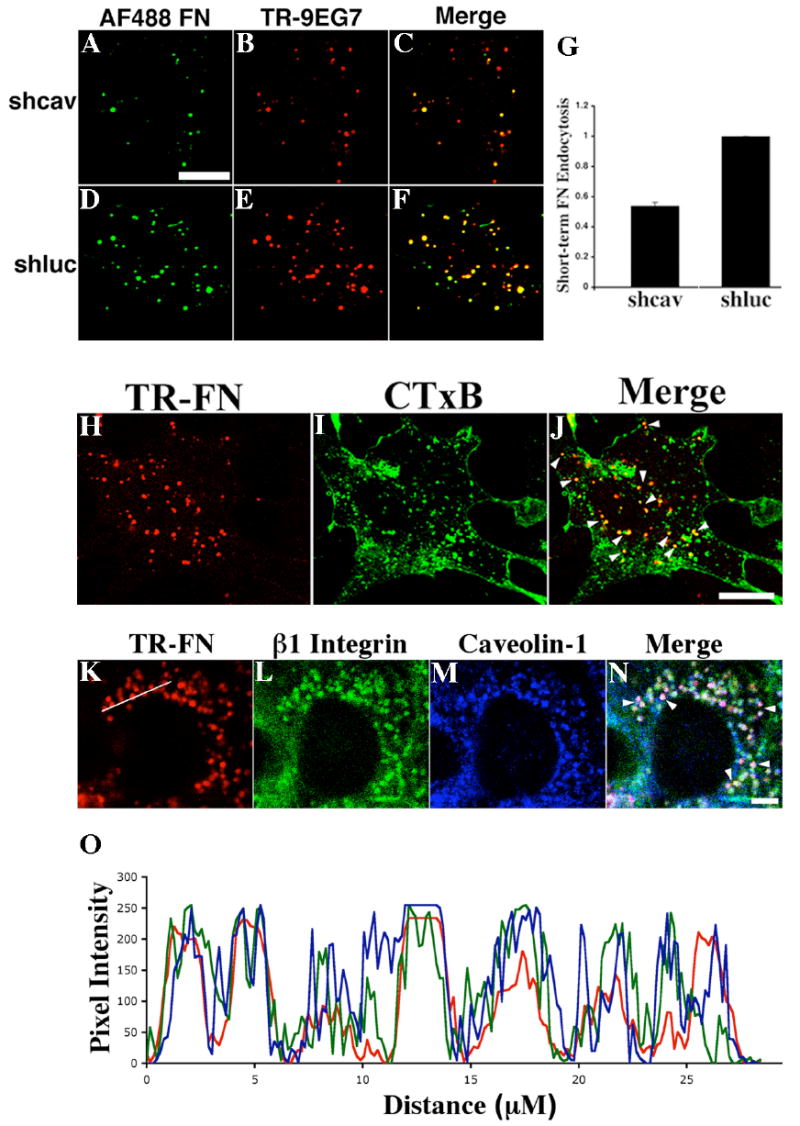
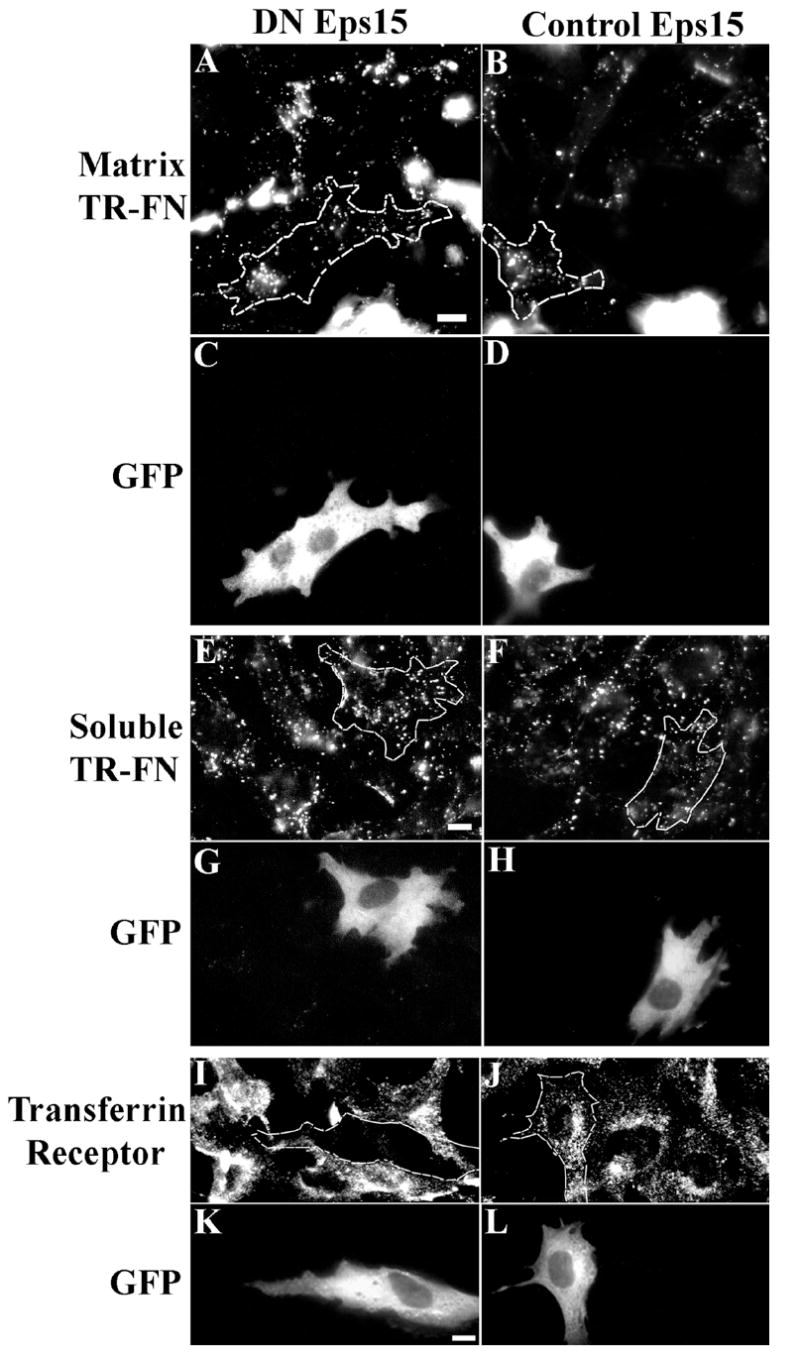
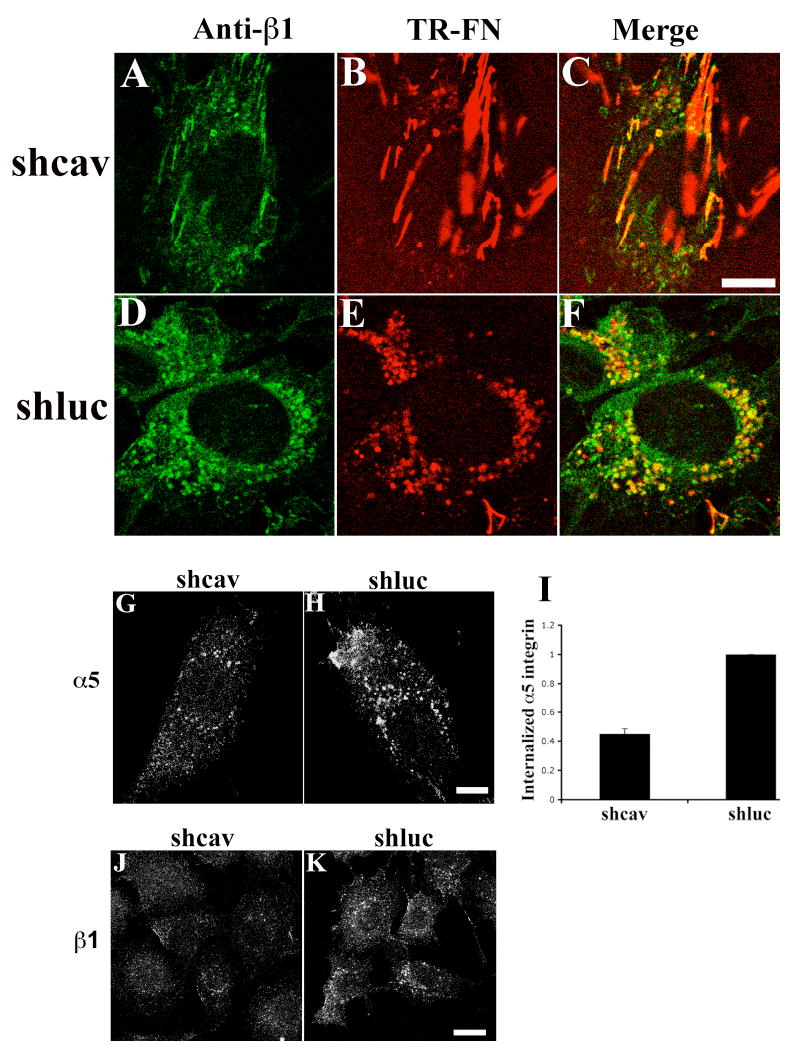
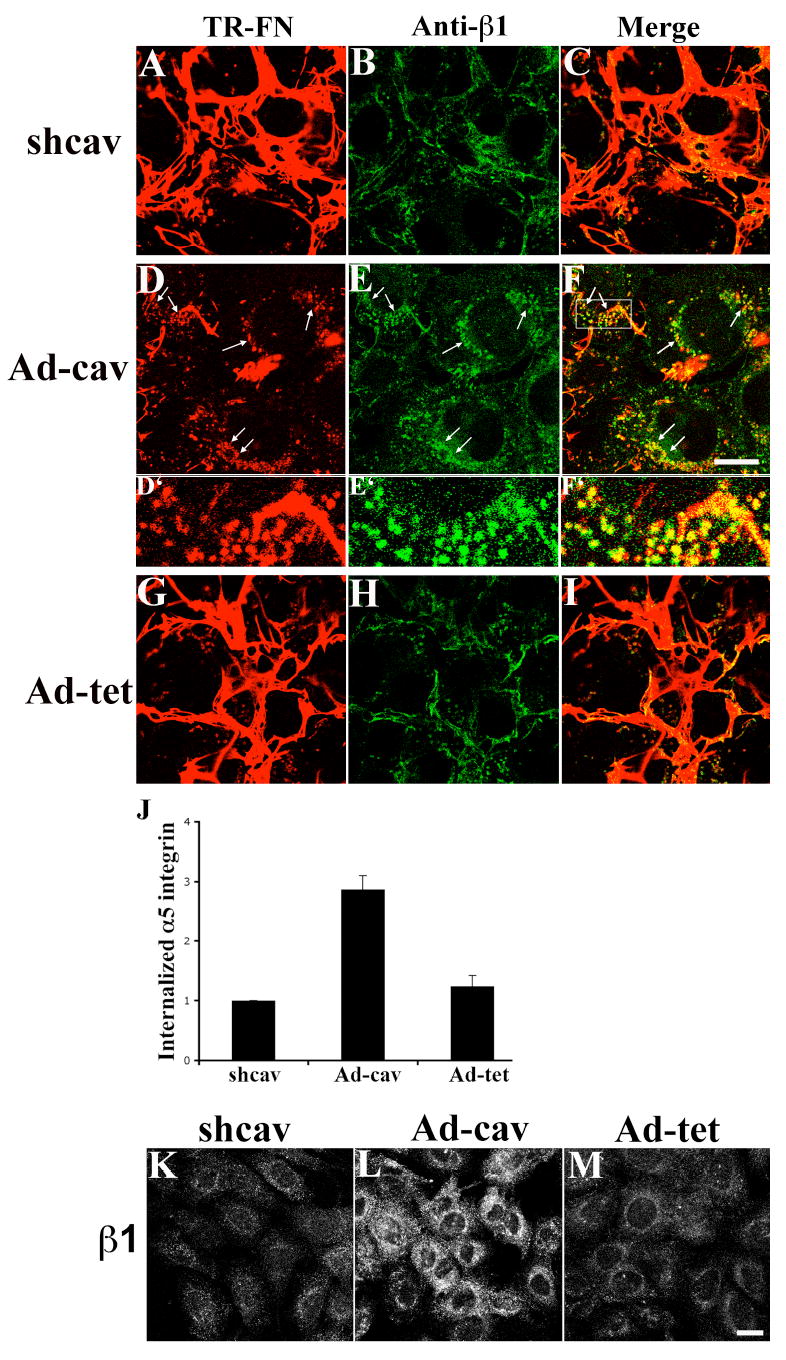
beta1 integrins are major cell surface receptors for fibronectin. Some integrins, including beta1 integrins, are known to undergo constitutive endocytosis and recycling. Integrin endocytosis/recycling has been implicated in the regulation of cell migration. However, the mechanisms by which integrin endocytosis/recycling regulates cell migration, and other biological consequences of integrin trafficking are not completely understood. We previously showed that turnover of extracellular matrix (ECM) fibronectin occurs via receptor-mediated endocytosis. Here, we investigate the biological relevance of beta1 integrin endocytosis to fibronectin matrix turnover. First, we demonstrate that beta1 integrins, including alpha5beta1 play an important role in endocytosis and turnover of matrix fibronectin. Second, we show that caveolin-1 constitutively regulates endocytosis of alpha5beta1 integrins, and that alpha5beta1 integrin endocytosis can occur in the absence of fibronectin and fibronectin matrix. We also show that downregulation of caveolin-1 expression by siRNA results in marked reduction of beta1 integrin and fibronectin endocytosis. Hence, caveolin-1-dependent beta1 integrin and fibronectin endocytosis plays a critical role in fibronectin matrix turnover, and may contribute to abnormal ECM remodeling that occurs in fibrotic disorders.


Figures

Figure 1
Figure 1. Colocalization of internalized fibronectin with β1 integrins
(A-C) FN-null MFs were incubated with 10 μg/mL TR-fibronectin overnight. Cells were washed and then incubated for 12 hours in cell culture media lacking fibronectin, but containing 50 μM chloroquine. Cells were stained with an anti-β1 integrin antibody (HMβ1-1). A, TR-fibronectin; B, β1 integrin; C, overlay image. (D-F) FN-null MFs were incubated with 10 μg/ml TR-fibronectin overnight. Cells were washed, and then incubated with 10 μg/mL 9EG7 at 4°C for 30 minutes. Cells were washed, and then chased for 4 hours with cell culture media lacking fibronectin, but containing 100 μM chloroquine. Cells were stained with a FITC-conjugated secondary antibody. D, TR-fibronectin; E, 9EG7 (β1 integrin); F, overlay image. (G-I) SMCs were incubated with 10 μg/mL TR-fibronectin and 50 μM chloroquine for 12 hours. Cells were stained using an anti-β1 integrin antibody. G, TR-fibronectin; H, β1 integrin (FITC); I, overlay image. All images are optical sections collected from a confocal microscope. Scale bar, 10μm.
Figure 2
Figure 2. Colocalization of internalized fibronectin and β1 integrins shortly after initiation of endocytosis
FN-Null MFs were incubated with 10 μg/mL TR-fibronectin and 50 μg/mL FITC-conjugated 9EG7 at 4°C for 1 hour during the pulse. After 30 minutes of chase at 37°C, cells were incubated with 0.2% trypan blue for 3 minutes to quench extracellular fluorescence. A, TR-fibronectin; B, FITC-conjugated 9EG7; C, overlay images. Arrowheads in C point to colocalized TR-Fibronectin and FITC-9EG7. These images are optical sections collected from a confocal microscope. Scale bar, 10 μm.
Figure 3
Figure 3. Colocalization of internalized fibronectin with α5 integrins
SMCs were incubated with 10 μg/mL TR-fibronectin and 50 μM chloroquine for 8 hours. Cells were stained using an anti-α5 integrin antibody (AB1928). A, TR-fibronectin; B, α5 integrin; C, overlay image. These images are optical sections collected from a confocal microscope. Scale bar, 10μm.
Figure 4
Figure 4. Quantitation of Fibronectin endocytosis
(A) FN-null MFs were incubated with 2.5-50 μg/mL AF488-conjugated fibronectin at 4°C during the pulse phase (total endocytosis). Some samples were co-incubated with 800 μg/mL unlabeled fibronectin to determine non-specific endocytosis. Cells were chased in the absence of fibronectin for 2 hours at 37°C, and then processed for flow cytometry to quantitate endocytosed fibronectin. Specific endocytosis was determined by subtracting non-specific endocytosis from total endocytosis. The graph in A shows the best-fit curve of the mean fluorescence intensity (MFI) of internalized AF488-fibronectin. Data represents the mean of duplicate samples and error bars the range. (B) FN-null MFs were incubated with 10 μg/mL AF488-fibronectin in the presence of increasing concentrations of unlabeled fibronectin (0-800 μg/mL) during the pulse phase. Cells were chased in the absence of fibronectin for 2 hours at 37°C, and then processed for flow cytometry to quantitate endocytosed AF488-fibronectin. The amount of internalized AF488-fibronectin is reported as percent control internalization (cells incubated in the absence of unlabelled fibronectin, which was set equal to 100%). Data represents the mean of duplicate samples and error bars the range.
Figure 5
Figure 5. Blocking of β1 integrin inhibits fibronectin endocytosis
(A-C) FN-null MFs were incubated with 25 μg/mL β1 antibodies (Ha2/5) or isotype control antibodies at 4°C for 30 minutes. 10 μg/mL TR-fibronectin (A, B) or AF488-fibronectin (C) was then added to the media and cells were processed for fibronectin endocytosis pulse-chase assays. After 2 hours of chase, cells were either fixed for imaging assay (A, β1 inhibition; B, isotype control), or processed for flow cytometry to quantitate endocytosed fibronectin (C). The numbers over the peaks in C are the MFI of internalized AF 488-fibronectin. (D-F) SMCs were seeded in serum free media on vitronectin-coated dishes. Cells were allowed to adhere for 3 hours and then processed for integrin blocking assay as described above for FN-null MFs. (D) 25 μg/mL β1 inhibitory antibodies (Ha2/5); (E) isotype control; Blue: DAPI. (F) Quantitation of endocytosed fibronectin in SMCs by flow cytometry. The numbers over the peaks in F are the MFI of internalized AF 488-fibronectin. Scale bar, 10μm.
Figure 6
Figure 6. Blocking of β1 integrins inhibits endocytosis of fibronectin from pre-assembled matrix
FN-null MFs were incubated with either 30 μg/mL β1 inhibitory antibody (Ha2/5) or isotype control in suspension at room temperature for 30 minutes prior to seeding on pre-assembled TR-(A, B) or AF488 (C, D)-fibronectin matrix. Cells were cultured for 24 hours at 37°C, and were then either fixed for imaging assay (A, β1 inhibition; B, isotype control) or processed for flow cytometry to quantitate internalized fibronectin (C, D). The numbers over the peaks in C are the MFI of internalized AF 488-fibronectin. Graph in D shows fold change relative to the MFI of endocytosed AF488-fibronectin in cells treated with isotype control IgM, which was set equal to 1 (n=4, mean ± s.d.). Scale bar, 10μm.
Figure 7
Figure 7. Reduced endocytosis and turnover of pre-assembled fibronectin matrix in β1-integrin-null cells
GD25 and GD25 β1 re-expressing cells were seeded on pre-assembled TR- (A, B, D, E, F, G) or AF488 (C)-fibronectin matrix and incubated for 24 hours at 37°C. (A-B) Cells were incubated with 0.2% trypan blue for 3 minutes and then fixed. Intracellular fibronectin vesicles are shown (A, GD25; B, GD25 β1). The insets show outlines of cells loaded with CellTracker Green. Scale bar, 10μM. (C) Cells were processed for flow cytometry to quantitate endocytosed fibronectin. The numbers over the peaks in C are the MFI of internalized AF 488-fibronectin. (D-G) Cells were fixed without trypan blue treatment to visualize fibronectin fibrils (D, E, GD25; F, G, GD25 β1; E and G are phase images of corresponding fields). Scale bar, 40μm.
Figure 8
Figure 8. Blocking of α5 integrin partially inhibits fibronectin endocytosis
FN-null MFs were incubated with 50 μg/mL α5 inhibitory antibodies (5H10-27), or 100 μg/mL αv inhibitory antibodies (H9.2B8), or isotype control IgG at 4°C for 30 minutes. 10 μg/mL TR-fibronectin (A-D) or AF488-fibronectin (E) was added to the media. After 2 hours chase, cells were either fixed for imaging analysis (A, α5 inhibition; B, isotype control of α5; C, αv inhibition; D, isotype control for αv), or processed for flow cytometry (E) to quantitate internalized fibronectin. The numbers over the peaks in E are the MFI of internalized AF 488-fibronectin. Scale bar, 10μm.
Figure 9
Figure 9
(A-F) Caveolin-1 regulates short-term fibronectin endocytosis. Cells expressing caveolin-1 siRNA (shcav, A-C) or control siRNA (shluc, D-F) were incubated with 10 μg/mL AF488-fibronectin and 50 μg/mL TR-conjugated 9EG7 at 4°C for 1 hour during the pulse. After 30 minutes of chase at 37°C, cells were incubated with 0.2% trypan blue for 3 minutes to quench extracellular fluorescence. AF488-fibronectin, A,D; TR-9EG7, B,E; overlay images, C,F. Scale bar, 10μm. (G) Flow cytometric analysis of endocytosed fibronectin. Cells expressing caveolin-1 siRNA (shcav) or control siRNA (shluc) were incubated with 10μg/mL AF488-fibronectin at 4°C for 1 hour in the presence or absence of 1mg/ml unlabeled fibronectin. After 30 minutes of chase, cells were processed for flow cytometry. The specific MFI was determined by subtracting the total MFI (shcav, 315; shluc, 489) from the MFI of cells incubated with unlabeled fibronectin (shcav, 147; shluc, 177). Data show the fold change relative to the MFI of endocytosed AF488-fibronectin in control cells, which was set equal to 1 (mean±range). (H-J) Colocalization of internalized fibronectin with lipid raft marker. FN-null MFs were incubated with 10 μg/mL TR-fibronectin and 2 μg/mL AF488-CTxB at 4°C for 1 hour. After 2 hours of chase, cell were incubated with 0.2% trypan blue for 3 minutes and then processed for imaging assay (H, TR-fibronectin; I, AF488-CTxB; J, overlay image, arrowheads point to colocalized TR-fibronectin and AF488-CTxB). (K-O) Colocalization of internalized fibronectin, β1 integrins and caveolin-1. FN-null MFs were incubated with 10 μg/mL TR-fibronectin overnight. Cells were washed and then incubated for 12 hours in cell culture media lacking fibronectin, but containing 50 μM chloroquine. Cells were stained with anti-β1 integrin and anti-caveolin-1 antibodies, followed by FITC-conjugated anti-hamster and Alexa Fluor 660-conjugated anti-rabbit secondary antibodies. (K, TR-fibronectin; L, β1 integrin; M, caveolin-1; N, overlay image, arrowheads show the white staining that indicates the colocalization of triple colors). Fluorescence intensity profiles (O) were generated using ImageJ software (National Institutes of Health, Bethesda, Maryland, USA). A line was manually drawn to cross several TR-fibronectin containing vesicles (as shown in K) and the fluorescence intensity profiles were obtained from each individual color channel. The plot in O was generated in Excel (Microsoft, Seattle) (red, TR-Fibronectin; green, β1 integrin; blue, caveolin-1). All images are optical sections collected from a confocal microscope. Scale bar, 10μm.
Figure 10
Figure 10. Dominant negative (DN) Eps15 does not inhibit fibronectin endocytosis
DN Eps15 (A, C, E, G, I, K) or control Eps15 (B, D, F, H, J, L) were transiently expressed in FN-null MFs as described in Methods. (A-D) Transfected cells were seeded onto pre-assembled matrices and incubated for 24 h. Endocytosed fibronectin is shown in (A, B). (E-H) Short-term pulse chase experiments were performed with transfected cells. (E, F) show endocytosed fibronectin following 2 hr of chase. (I-L) The effect of DN and control Eps15 on transferrin receptor endocytosis is shown. Transfected cells were detected by GFP expression (C, D, G, H, K, L) and manually outlined. 15-20 cells were analyzed for each condition; representative images are shown. Scale bar, 10μm.
Figure 11
Figure 11. Integrin endocytosis in caveolin-1-knockdown cells
(A-F) Cells expressing caveolin-1 siRNA (shcav) or control cells (shluc) were incubated with 10 μg/mL TR-fibronectin overnight. Cells were washed, and then incubated for 8 hours in cell culture media lacking fibronectin, but containing 50 μM chloroquine. Cells were stained with anti-β1 integrin antibody (FITC). Upper panels, shcav; lower panels, shluc. A and D, β1 integrin; B and E, TR-fibronectin; C and F, overlay images. (G-K) Cells expressing caveolin-1 siRNA (shcav, G,J) or control cells (shluc, H,K) were incubated with 50 μg/mL antibodies to α5 integrin (G-I) or β1 integrin (J, K) at 4°C for 45 minutes. Cells were then processed for integrin endocytosis assay as described in Methods. The fluorescence intensity of endocytosed α5 integrin (G, H) was quantitated using a MATLab based program. (I) Fold change relative to the fluorescence intensity of endocytosed α5 integrin in shluc cells, which was set equal to 1 (mean±range from 2 independent experiments). All images are optical sections collected from a confocal microscope. Scale bar, 10μm.
Figure 12
Figure 12. Re-expression of caveolin-1 rescues endocytosis of β1 integrin in shcav cells
FN null MFs expressing caveolin-1 siRNA (shcav) were transduced with Ad-cav or Ad-tet adenoviruses as described in Methods. (A-I) Cells were incubated with 10 μg/mL TR-fibronectin overnight. Cells were washed, and then incubated for 8 hours in cell culture media lacking fibronectin, but containing 50 μM chloroquine. Cells were stained with anti-β1 integrin antibody (FITC). Upper panels, shcav without virus transduction; middle panels, Ad-cav; lower panels, Ad-tet. A, D and G: TR-fibronectin; B, E and H: β1 integrin; C, F and I, overlay images. Arrows in D show the internalized fibronectin; arrows in E show intracellular β1 integrins; arrows in F show colocalized fibronectin and β1 integrins. D’, E’ and F’ are enlarged images of area shown by the rectangle in F. (J-M) In the absence of fibronectin, cells were incubated with 50 μg/mL antibodies to α5 integrin (J) or β1 integrin (K-M) at 4°C for 45 minutes. Cells were then processed for integrin endocytosis assay as described in Methods. (J) The fluorescence intensity of endocytosed α5 integrin was quantitated using a MATLab based program. Graph in J shows the relative fluorescence intensity of endocytosed α5 integrin in shcav cells with or without virus transduction. Intracellular fluorescence intensity of shcav cells without virus transduction was set equal to 1 (mean±range from 2 independent experiments). All images are optical sections collected from confocal microscope. Scale bar, 20μm.

References

    1. Aplin AE, Howe AK, Juliano RL. Cell adhesion molecules, signal transduction and cell growth. Current Opinion Cell Biol. 1999;11:737–744. - PubMed
    1. Bazzoni G, Shih DT, Buck CA, Hemler ME. Monoclonal antibody 9EG7 defines a novel beta 1 integrin epitope induced by soluble ligand and manganese, but inhibited by calcium. J Biol Chem. 1995;270:25570–7. - PubMed
    1. Beardsley A, Fang K, Mertz H, Castranova V, Friend S, Liu J. Loss of caveolin-1 polarity impedes endothelial cell polarization and directional movement. J Biol Chem. 2005;280:3541–7. - PubMed
    1. Benmerah A, Lamaze C, Begue B, Schmid SL, Dautry-Varsat A, Cerf-Bensussan N. AP-2/Eps15 interaction is required for receptor-mediated endocytosis. J Cell Biol. 1998;140:1055–1062. - PMC - PubMed
    1. Benmerah A, Bayrou M, Cerf-Bensussan N, Dautry-Varsat A. Inhibition of clathrin-coated pit assembly by an Eps15 mutant. J Cell Sci. 1999;112:1303–11. - PubMed

Publication types