. 2008 Jun;20(6):1708-24.
doi: 10.1105/tpc.108.059733. Epub 2008 Jun 24.

Spermidine exodus and oxidation in the apoplast induced by abiotic stress is responsible for H2O2 signatures that direct tolerance responses in tobacco

Affiliations

Spermidine exodus and oxidation in the apoplast induced by abiotic stress is responsible for H2O2 signatures that direct tolerance responses in tobacco

Panagiotis N Moschou et al. Plant Cell. 2008 Jun.

Abstract

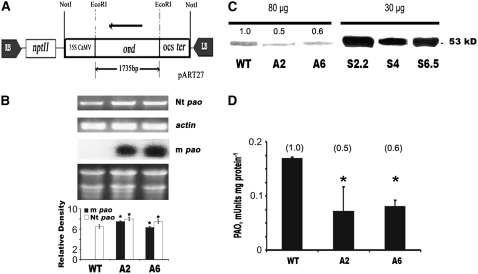
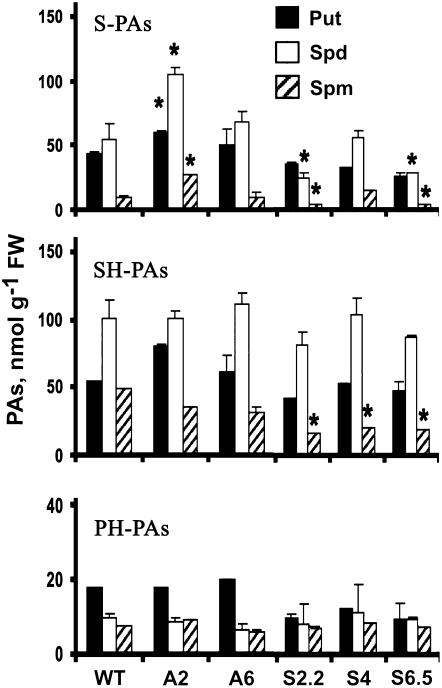
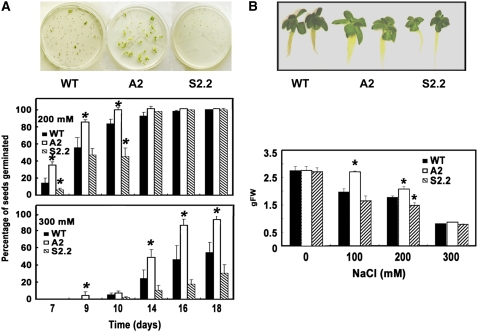
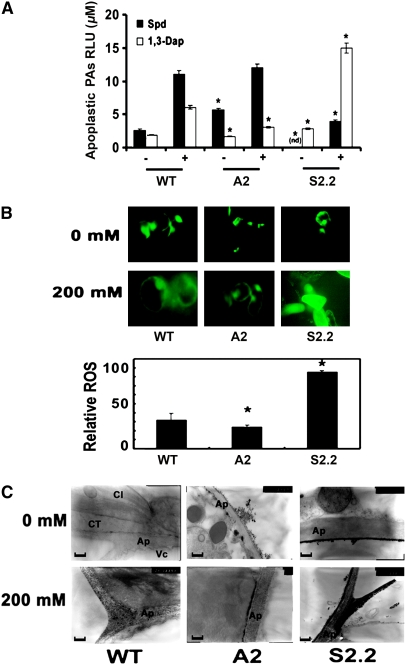
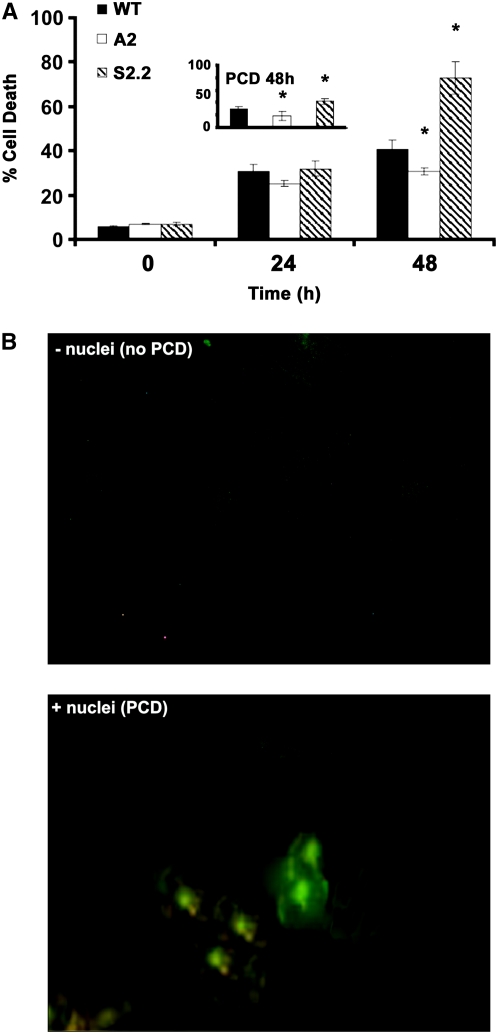
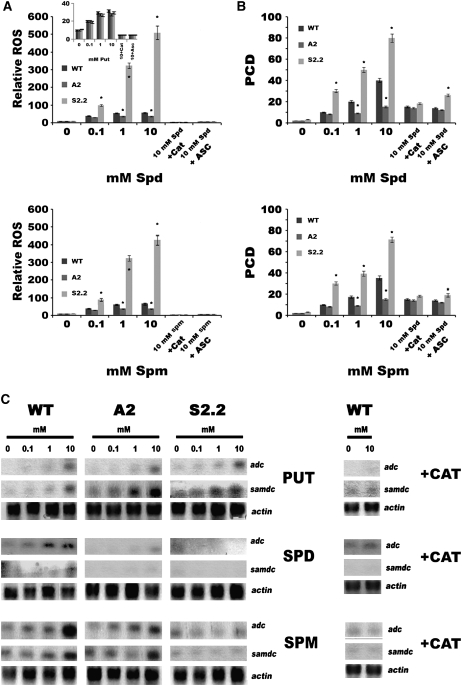
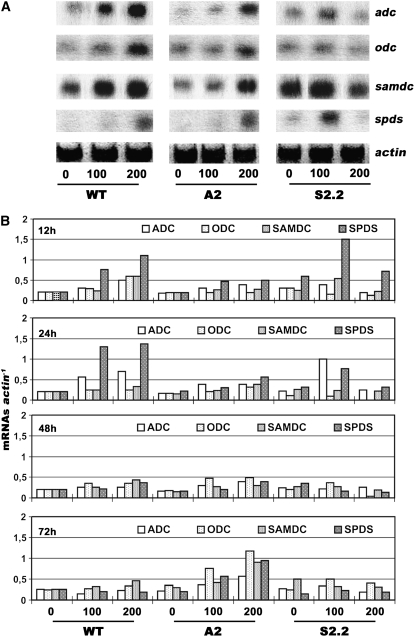
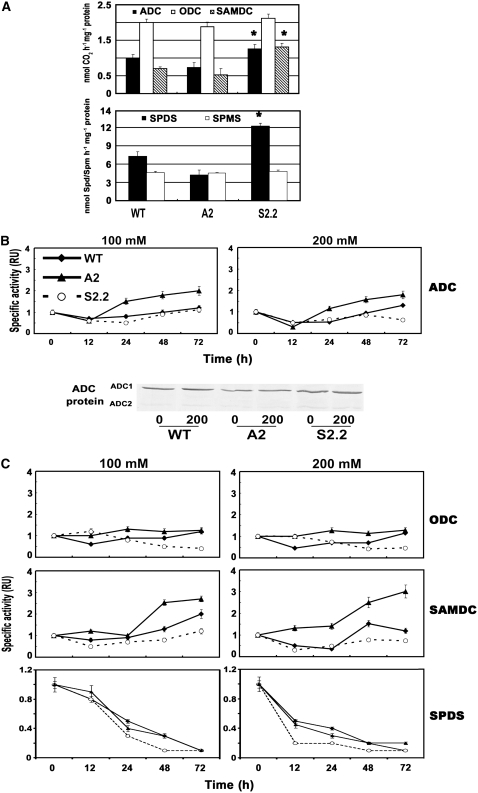
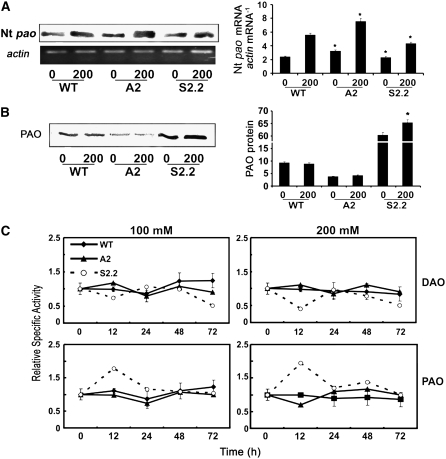
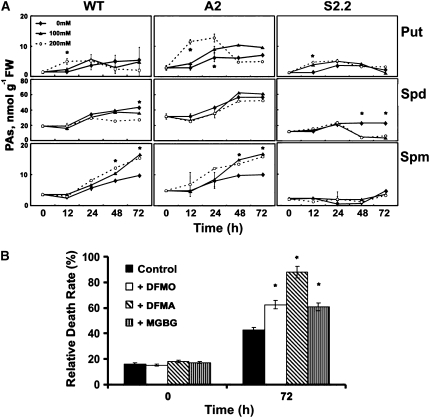
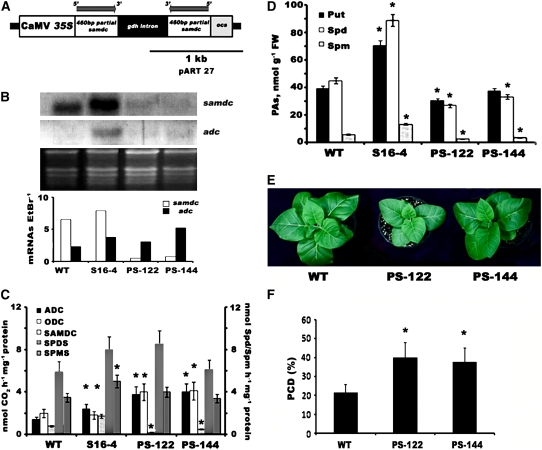
Polyamines (PAs) exert a protective effect against stress challenges, but their molecular role in this remains speculative. In order to detect the signaling role of apoplastic PA-derived hydrogen peroxide (H2O2) under abiotic stress, we developed a series of tobacco (Nicotiana tabacum cv Xanthi) transgenic plants overexpressing or downregulating apoplastic polyamine oxidase (PAO; S-pao and A-pao plants, respectively) or downregulating S-adenosyl-l-methionine decarboxylase (samdc plants). Upon salt stress, plants secreted spermidine (Spd) into the apoplast, where it was oxidized by the apoplastic PAO, generating H2O2. A-pao plants accumulated less H2O2 and exhibited less programmed cell death (PCD) than did wild-type plants, in contrast with S-pao and samdc downregulating plants. Induction of either stress-responsive genes or PCD was dependent on the level of Spd-derived apoplastic H2O2. Thus, in wild-type and A-pao plants, stress-responsive genes were efficiently induced, although in the latter at a lower rate, while S-pao plants, with higher H2O2 levels, failed to accumulate stress-responsive mRNAs, inducing PCD instead. Furthermore, decreasing intracellular PAs, while keeping normal apoplastic Spd oxidation, as in samdc downregulating transgenic plants, caused enhanced salinity-induced PCD. These results reveal that salinity induces the exodus of Spd into the apoplast, where it is catabolized by PAO, producing H2O2. The accumulated H2O2 results in the induction of either tolerance responses or PCD, depending also on the levels of intracellular PAs.


Figures

Figure 1.
Figure 1.
A-pao Generation and Analysis of PAO mRNA, Protein, and Activity Levels. (A) Construct used for the production of stable A-pao lines. RB, right border; nptII, neomycin phosphotransferase II; 35S CaMV, 35S promoter from the Cauliflower mosaic virus; pao, m pao cDNA expressed in the antisense direction; ocs ter, octopine synthase transcription terminator; LB, left border. (B) RT-PCR (top) showing endogenous pao (Nt pao) and actin mRNA levels and RNA gel blot analysis of the antisense m pao transcript (middle, with gel showing equal loading below). Densitometric analysis (bottom) is shown for both m pao and Nt pao. In both cases, mRNAs were equalized against actin. (C) PAO protein levels in wild-type, A2, and A6 antisense lines (80 μg total protein/well). Numbers above the bands correspond to the relative intensities of the signals compared with wild-type plants. For comparison, a protein gel blot of PAO from the sense lines S2.2, S4, and S6.5 (Moschou et al., 2008) is shown (30 μg total protein/well). (D) PAO activity levels in wild-type, A2, and A6 antisense lines (milliunits/mg protein). The numbers above the bars represent relative activities of the lines with respect to wild-type plants. Data are means ± se of three independent experiments, and asterisks indicate statistical significance at P < 0.05.
Figure 2.
Figure 2.
S-, SH-, and PH-PA Titers in Wild-Type, A2, A6, S2.2, S4, and S6.5 Transgenic Lines. PAs are expressed in nanomoles per gram fresh weight (FW). Closed bars, Put; open bars, Spd; striped bars, Spm. Data are means ± se of three independent experiments, and asterisks indicate statistical significance at P < 0.05.
Figure 3.
Figure 3.
Wild-Type, S2.2, and A2 Transgenic Line Phenotypes under Salinity Stress. (A) Seed viability in wild-type, A2, and S2.2 plants in MS medium supplemented with 300 mM NaCl (top), and rate of seed germination at 200 and 300 mM NaCl (bottom). (B) Plant growth phenotype of wild-type, A2, and S2.2 transgenic lines treated with 200 mM NaCl (top), and fresh weight of wild-type, A2, and S2.2 transgenic lines treated with 0, 100, 200, and 300 mM NaCl (bottom). Data are means ± se of three independent experiments, and asterisks indicate statistical significance at P < 0.05.
Figure 4.
Figure 4.
Apoplastic S-Spd and 1,3-Dap Titers, ROS Epifluorescence, and Localization in Salt-Treated Cell Suspensions and Plants. (A) Apoplastic S-Spd and 1,3-Dap levels in wild-type, A2, and S2.2 transgenic lines at 72 h after treatment with 0 (−) and 200 mM (+) NaCl. RLU, relative units. (B) ROS epifluorescence in cell suspension cultures from wild-type, A2, and S2.2 transgenic lines at 24 h after treatment with 0 or 200 mM NaCl using the highly specific ROS probe DCFMA (top), and relative ROS fluorescence as measured by pixel analysis (bottom). (C) Quantitative in situ ROS localization in the apoplast of wild-type, A2, and S2.2 transgenic lines using transmission electron microscopy and cerium chloride, which precipitates in the presence of H2O2, forming black adducts. Plants were treated with 0 or 200 mM NaCl, and bars indicate 0.4 μm. Ap, apoplast; Cl, chloroplast; CT, cytoplasm; Vc, vacuole. Data in (A) and (B) are means ± se of three independent experiments, and asterisks indicate statistical significance at P < 0.05. Data in (C) represent a single representative experiment replicated three times.
Figure 5.
Figure 5.
Cell Death Rate and PCD in Cell Suspension Cultures Exposed to Salinity. (A) Rates of cell death measured using Evans blue or PCD at 48 h (inset) after treatment with 200 mM NaCl in wild-type, A2, and S2.2 transgenic plants. Data are means ± se of three independent experiments, and asterisks indicate statistical significance at P < 0.05. (B) PCD observed in wild-type cells (−NaCl, top panel; +NaCl, bottom panel) using the TUNEL assay, whereby nuclei are observed only in cells undergoing PCD treated with 200 mM NaCl (bottom panel).
Figure 6.
Figure 6.
ROS Levels and PCD in Cell Suspension Cultures and Expression Patterns of adc and samdc in Wild-Type, A2, and S2.2 Transgenic Lines after Treatment with 0.1, 1, and 10 mM Put, Spd, and Spm. (A) Epifluorescent relative ROS quantification in cell suspensions treated with 0.1, 1, and 10 mM Spd and Put (inset) at 1 h after treatment using the highly specific ROS probe DCFMA. (B) Percentage of cells undergoing PCD in cell suspensions at 24 h after treatment as measured using the TUNEL assay, whereby positive nuclei are observed only in cells undergoing PCD. (C) RNA gel blot analysis of adc and samdc in fully developed leaves at 6 h after treatment. Equal loading against actin is shown, and simultaneous addition of catalase with the corresponding PA represents the negative control. Data in (A) and (B) are means ± se of three independent experiments, and asterisks indicate statistical significance at P < 0.05. Data in (C) represent a single representative experiment replicated twice. In all cases, treatments with catalase (CAT) and ascorbate (ASC) represent negative controls.
Figure 7.
Figure 7.
Expression Patterns of adc, odc, samdc, and spds in Wild-Type, A2, and S2.2 Transgenic Plants under Control and Salinity Conditions using 100 and 200 mM NaCl. (A) RNA gel blot analysis of the expression of adc, odc, samdc, and spds genes at 12 h after the onset of salt stress. (B) mRNA level quantification (mRNA/actin) at 12, 24, 48, and 72 h after treatment. Data represent a single representative experiment replicated three times.
Figure 8.
Figure 8.
ADC, ODC, SAMDC, SPDS, and SPMS Specific Activities and ADC Protein Levels in Control and Salinity Conditions of Wild-Type, A2, and S2.2 Transgenic Plants. (A) Specific activities in control plants of ADC, ODC, and SAMDC (nmol CO2·h−1·mg−1 protein), SPDS (nmol Spd·h−1·mg−1 protein), and SPMS (nmol Spm·h−1·mg−1 protein). (B) Time course of ADC specific activity, at 100 and 200 mM NaCl, and ADC (cytosolic [ADC1] and chloroplastic [ADC2]) protein levels in 0 and 200 mM NaCl at 72 h after the onset of stress. (C) Time course of ODC, SAMDC, and SPDS specific activity at 100 and 200 mM NaCl. All data are means ± se of three independent experiments, and asterisks indicate statistical significance at P < 0.05.
Figure 9.
Figure 9.
Levels of PAO mRNA, Protein, and Activity and DAO Activity in Wild-Type, A2, and S2.2 Transgenic Plants under Control and Salinity Conditions. (A) RT-PCR for the endogenous pao mRNA levels, product hybridization against an Nt pao 32P-labeled probe, and densitometric analysis (right) in wild-type, A2, and S2.2 lines treated with 0 or 200 mM NaCl, normalized to actin. (B) PAO protein levels and densitometric analysis (right) in wild-type, A2, and S2.2 lines treated with 0 or 200 mM NaCl. (C) DAO and PAO activity levels over time in wild-type, A2, and S2.2 lines treated with the indicated levels of NaCl. Data are means ± se of three independent experiments, and asterisks indicate statistical significance at P < 0.05.
Figure 10.
Figure 10.
S-Put, S-Spd, and S-Spm Accumulation and Effect of PA Biosynthesis Inhibitors on Cell Death Rate. (A) S-PA accumulation over time in wild-type, A2, and S2.2 hydroponically grown transgenic plants supplemented with 0, 100, and 200 mM NaCl. (B) Effect of the ADC, ODC, and SAMDC inhibitors DFMA, DFMO, and MGBG, respectively, on cell death rate of wild-type hydroponically grown plants supplemented with 200 mM NaCl. Data are means ± se of three independent experiments, and asterisks indicate statistical significance at P < 0.05.
Figure 11.
Figure 11.
Characterization of SAMDC Tobacco RNAi Lines: samdc and adc mRNA Levels; ADC, ODC, SAMDC, SPDS, and SPMS Specific Activities; PA Titers; Plant Phenotypes; and PCD Rates under Salinity. (A) Construct used for the generation of stable tobacco RNAi samdc lines. CaMV 35S, 35S promoter from the Cauliflower mosaic virus; 460bp partial samdc, fragment of the samdc cDNA in either the sense or antisense orientation; gdh intron, Glu dehydrogenase intron; ocs, octopine synthase transcription terminator. (B) RNA gel blot analysis of samdc and adc mRNA levels and quantification of mRNA levels (10 μg RNA/well) for the wild type, samdc-overexpressing line S16-4, and RNAi lines PS-122 and PS-144. (C) ADC, ODC, and SAMDC (nmol CO2·h−1·mg−1 protein), SPDS (nmol Spd·h−1·mg−1 protein), and SPMS (nmol Spm·h−1·mg−1 protein) specific activities. (D) Soluble PAs (nmol/g fresh weight [FW]). (E) Wild-type, PS-122, and PS-144 plants after a 2-week exposure to 200 mM NaCl. (F) Relative PCD rates (percentage of TUNEL-positive nuclei) in wild-type and PS-122 and PS-144 cell suspension cultures under salinity stress. Data are means ± se of three independent experiments, and asterisks indicate statistical significance at P < 0.05.

References

    1. Agalou, A., et al. (2008). A genome-wide survey of HD-Zip genes in rice and analysis of drought-responsive family members. Plant Mol. Biol. 66 87–103. - PubMed
    1. Alcazar, R., Marco, F., Cuevas, J.C., Patron, M., Ferrando, A., Carrasco, P., Tiburcio, A.F., and Altabella, T. (2006). Involvement of polyamines in plant response to abiotic stress. Biotechnol. Lett. 28 1867–1876. - PubMed
    1. Angelini, R., Federico, R., and Bonfante, P. (1995). Maize polyamine oxidase: Antibody production and ultrastructural localization. J. Plant Physiol. 145 686–692.
    1. Bestwick, C.S., Brown, I.R., Bennet, M.H., and Mansfield, J.W. (1997). Localization of hydrogen peroxide accumulation during the hypersensitive reaction of lettuce cells to Pseudomonas syringae pv phaseoliocola. Plant Cell 9 209–221. - PMC - PubMed
    1. Bouchereau, A., Aziz, A., Larher, F., and Martin-Tanguy, J. (1999). Polyamines and environmental challenges: Recent development. Plant Sci. 140 103–125.

MeSH terms

LinkOut - more resources