

Amplification of pulsatile glucagon counterregulation by switch-off of alpha-cell-suppressing signals in streptozotocin-treated rats
- PMID: 18577688
- PMCID: PMC2536740
- DOI: 10.1152/ajpendo.90372.2008
Amplification of pulsatile glucagon counterregulation by switch-off of alpha-cell-suppressing signals in streptozotocin-treated rats
Abstract
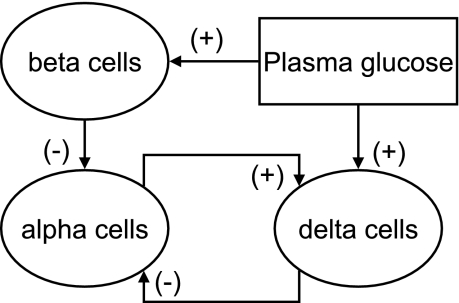
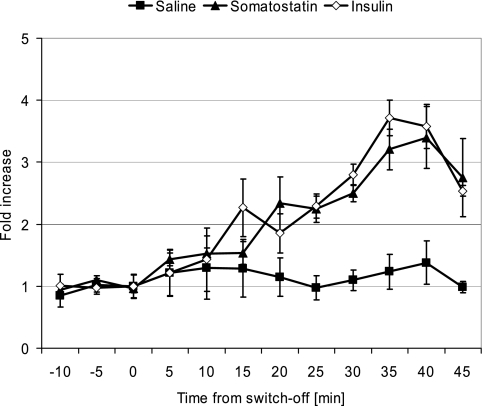
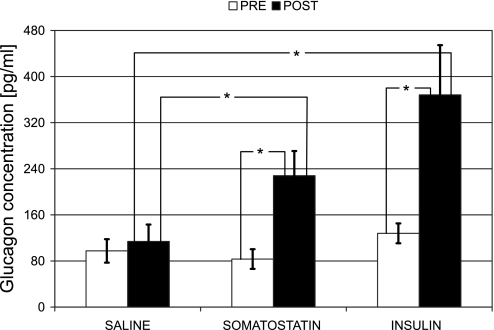
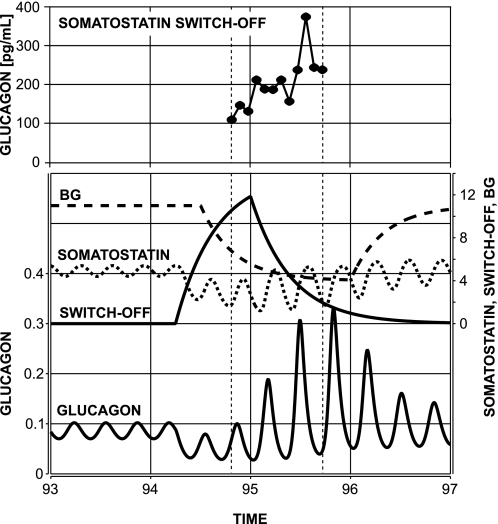
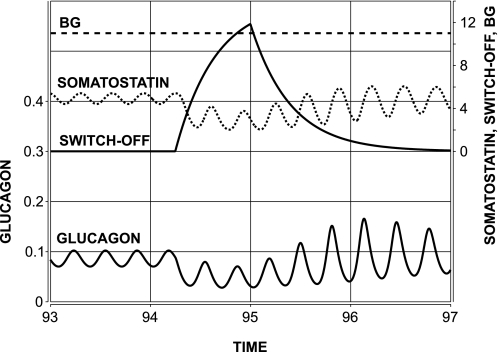
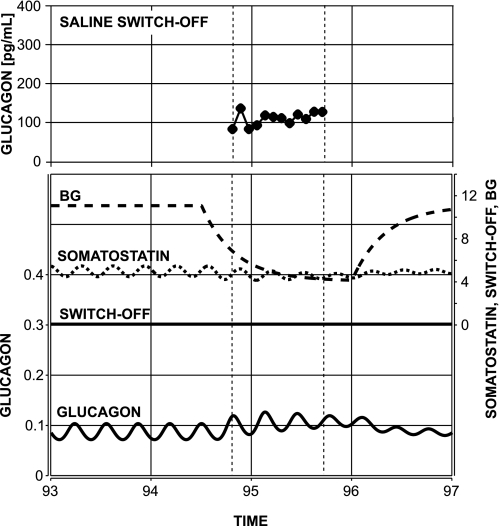
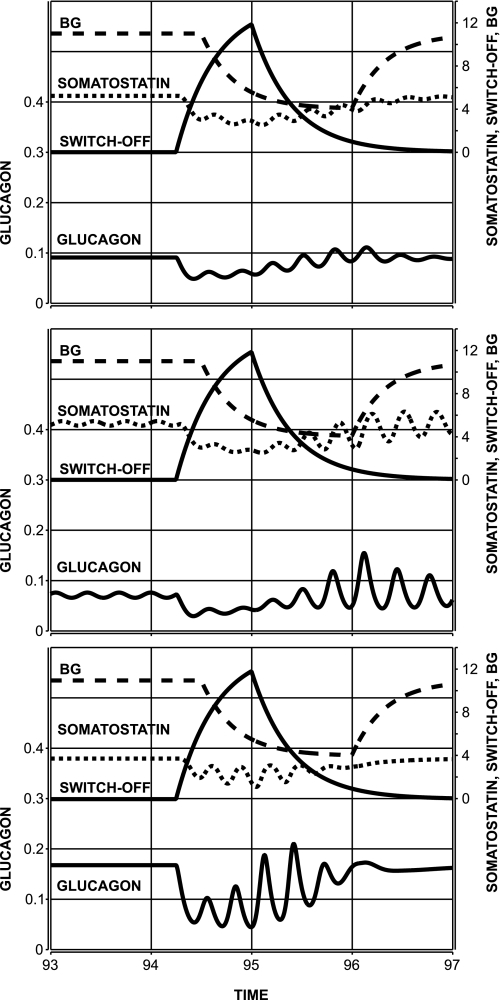
Glucagon counterregulation (GCR) is a key protection against hypoglycemia that is compromised in diabetes via an unknown mechanism. To test the hypothesis that alpha-cell-inhibiting signals that are switched off during hypoglycemia amplify GCR, we studied streptozotocin (STZ)-treated male Wistar rats and estimated the effect on GCR of intrapancreatic infusion and termination during hypoglycemia of saline, insulin, and somatostatin. Times 10 min before and 45 min after the switch-off were analyzed. Insulin and somatostatin, but not saline, switch-off significantly increased the glucagon levels (P = 0.03), and the fold increases relative to baseline were significantly higher (P < 0.05) in the insulin and somatostatin groups vs. the saline group. The peak concentrations were also higher in the insulin (368 pg/ml) and somatostatin (228 pg/ml) groups vs. the saline (114 pg/ml) group (P < 0.05). GCR was pulsatile in most animals, indicating a feedback regulation. After the switch-off, the number of secretory events and the total pulsatile production were lower in the saline group vs. the insulin and somatostatin groups (P < 0.05), indicating enhancement of glucagon pulsatile activity by insulin and somatostatin compared with saline. Network modeling analysis demonstrates that reciprocal interactions between alpha- and delta-cells can explain the amplification by interpreting the GCR as a rebound response to the switch-off. The model justifies experimental designs to further study the intrapancreatic network in relation to the switch-off phenomenon. The results of this proof-of-concept interdisciplinary study support the hypothesis that GCR develops as a rebound pulsatile response of the intrapancreatic endocrine feedback network to switch-off of alpha-cell-inhibiting islet signals.
Figures
Similar articles
-
Pancreatic network control of glucagon secretion and counterregulation.Methods Enzymol. 2009;467:547-581. doi: 10.1016/S0076-6879(09)67021-X. Methods Enzymol. 2009. PMID: 19897107 Free PMC article.
-
System-level control to optimize glucagon counterregulation by switch-off of α-cell suppressing signals in β-cell deficiency.J Diabetes Sci Technol. 2009 Jan;3(1):21-33. doi: 10.1177/193229680900300104. J Diabetes Sci Technol. 2009. PMID: 20046648 Free PMC article.
-
Regulation of alpha-cell function by the beta-cell during hypoglycemia in Wistar rats: the "switch-off" hypothesis.Diabetes. 2004 Jun;53(6):1482-7. doi: 10.2337/diabetes.53.6.1482. Diabetes. 2004. PMID: 15161752
-
Optimizing reduction in basal hyperglucagonaemia to repair defective glucagon counterregulation in insulin deficiency.Diabetes Obes Metab. 2011 Oct;13 Suppl 1(0 1):133-43. doi: 10.1111/j.1463-1326.2011.01455.x. Diabetes Obes Metab. 2011. PMID: 21824267 Free PMC article. Review.
-
Neurotransmitter control of islet hormone pulsatility.Diabetes Obes Metab. 2014 Sep;16 Suppl 1:102-10. doi: 10.1111/dom.12345. Diabetes Obes Metab. 2014. PMID: 25200303 Review.
Cited by
-
The median is not the only message: a clinician's perspective on mathematical analysis of glycemic variability and modeling in diabetes mellitus.J Diabetes Sci Technol. 2009 Jan;3(1):3-11. doi: 10.1177/193229680900300102. J Diabetes Sci Technol. 2009. PMID: 19756168 Free PMC article.
-
Models of glucagon secretion, their application to the analysis of the defects in glucagon counterregulation and potential extension to approximate glucagon action.J Diabetes Sci Technol. 2010 Nov 1;4(6):1345-56. doi: 10.1177/193229681000400608. J Diabetes Sci Technol. 2010. PMID: 21129329 Free PMC article.
-
Treating type 1 diabetes: from strategies for insulin delivery to dual hormonal control.Minerva Endocrinol. 2013 Jun;38(2):145-63. Minerva Endocrinol. 2013. PMID: 23732369 Free PMC article. Review.
-
Pancreatic network control of glucagon secretion and counterregulation.Methods Enzymol. 2009;467:547-581. doi: 10.1016/S0076-6879(09)67021-X. Methods Enzymol. 2009. PMID: 19897107 Free PMC article.
-
Paracrine regulation of glucagon secretion: the β/α/δ model.Am J Physiol Endocrinol Metab. 2016 Apr 15;310(8):E597-E611. doi: 10.1152/ajpendo.00415.2015. Epub 2016 Feb 2. Am J Physiol Endocrinol Metab. 2016. PMID: 26837808 Free PMC article.
References
-
- Ahren B, Taborsky GJ Jr, Havel PJ. Differential impairment of glucagon responses to hypoglycemia, neuroglycopenia, arginine, and carbachol in alloxan-diabetic mice. Metabolism 51: 12–19, 2002. - PubMed
-
- Ashcroft FM, Proks P, Smith PA, Ammala C, Bokvist K, Rorsman P. Stimulus-secretion coupling in pancreatic beta cells. J Cell Biochem 55, Suppl: 54–65, 1994. - PubMed
-
- Banarer S, McGregor VP, Cryer PE. Intraislet hyperinsulinemia prevents the glucagon response to hypoglycemia despite an intact autonomic response. Diabetes 51: 958–965, 2002. - PubMed
-
- Bell GI, Pilkis SJ, Weber IT, Polonsky KS. Glucokinase mutations, insulin secretion, and diabetes mellitus. Annu Rev Physiol 58: 171–186, 1996. - PubMed
-
- Bergman RN, Ider YZ, Bowden CR, Cobelli C. Quantitative estimation of insulin sensitivity. Am J Physiol Endocrinol Metab Gastrointest Physiol 236: E667–E677, 1979. - PubMed
Publication types
MeSH terms
Substances
Grants and funding
LinkOut - more resources
Full Text Sources