

Performance comparison of two microarray platforms to assess differential gene expression in human monocyte and macrophage cells
- PMID: 18578872
- PMCID: PMC2464609
- DOI: 10.1186/1471-2164-9-302
Performance comparison of two microarray platforms to assess differential gene expression in human monocyte and macrophage cells
Abstract
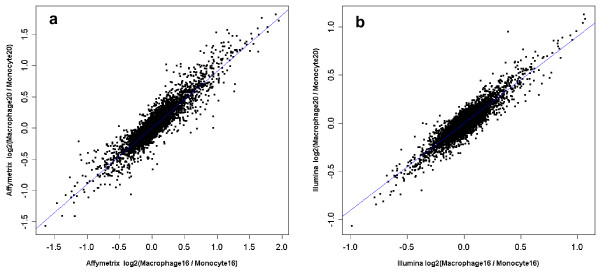
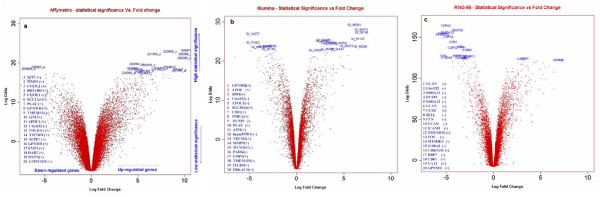
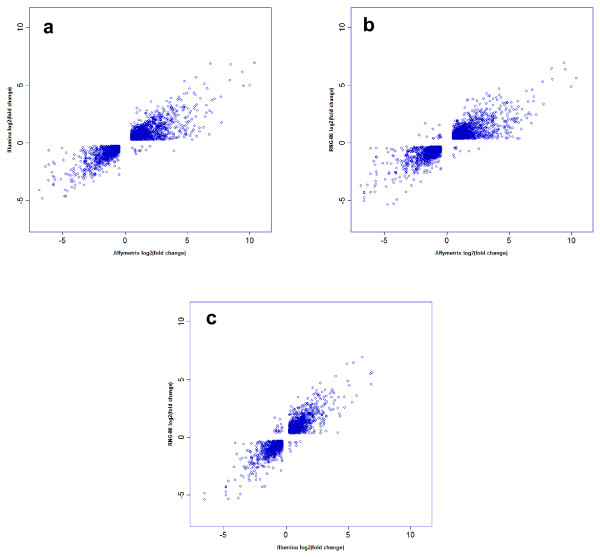
Background: In this study we assessed the respective ability of Affymetrix and Illumina microarray methodologies to answer a relevant biological question, namely the change in gene expression between resting monocytes and macrophages derived from these monocytes. Five RNA samples for each type of cell were hybridized to the two platforms in parallel. In addition, a reference list of differentially expressed genes (DEG) was generated from a larger number of hybridizations (mRNA from 86 individuals) using the RNG/MRC two-color platform.
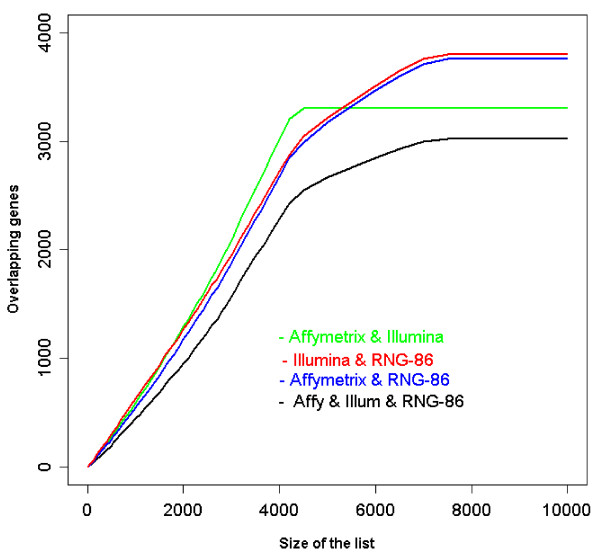
Results: Our results show an important overlap of the Illumina and Affymetrix DEG lists. In addition, more than 70% of the genes in these lists were also present in the reference list. Overall the two platforms had very similar performance in terms of biological significance, evaluated by the presence in the DEG lists of an excess of genes belonging to Gene Ontology (GO) categories relevant for the biology of monocytes and macrophages. Our results support the conclusion of the MicroArray Quality Control (MAQC) project that the criteria used to constitute the DEG lists strongly influence the degree of concordance among platforms. However the importance of prioritizing genes by magnitude of effect (fold change) rather than statistical significance (p-value) to enhance cross-platform reproducibility recommended by the MAQC authors was not supported by our data.
Conclusion: Functional analysis based on GO enrichment demonstrates that the 2 compared technologies delivered very similar results and identified most of the relevant GO categories enriched in the reference list.
Figures

Similar articles
-
Reproducibility of microarray data: a further analysis of microarray quality control (MAQC) data.BMC Bioinformatics. 2007 Oct 25;8:412. doi: 10.1186/1471-2105-8-412. BMC Bioinformatics. 2007. PMID: 17961233 Free PMC article.
-
Cross-platform comparison of SYBR Green real-time PCR with TaqMan PCR, microarrays and other gene expression measurement technologies evaluated in the MicroArray Quality Control (MAQC) study.BMC Genomics. 2008 Jul 11;9:328. doi: 10.1186/1471-2164-9-328. BMC Genomics. 2008. PMID: 18620571 Free PMC article.
-
Investigating the concordance of Gene Ontology terms reveals the intra- and inter-platform reproducibility of enrichment analysis.BMC Bioinformatics. 2013 Apr 29;14:143. doi: 10.1186/1471-2105-14-143. BMC Bioinformatics. 2013. PMID: 23627640 Free PMC article.
-
Microarray RNA transcriptional profiling: part I. Platforms, experimental design and standardization.Expert Rev Mol Diagn. 2006 Jul;6(4):535-50. doi: 10.1586/14737159.6.4.535. Expert Rev Mol Diagn. 2006. PMID: 16824028 Review.
-
Reproducible and reliable microarray results through quality control: good laboratory proficiency and appropriate data analysis practices are essential.Curr Opin Biotechnol. 2008 Feb;19(1):10-8. doi: 10.1016/j.copbio.2007.11.003. Epub 2007 Dec 26. Curr Opin Biotechnol. 2008. PMID: 18155896 Review.
Cited by
-
Working Towards a Blood-Derived Gene Expression Biomarker Specific for Alzheimer's Disease.J Alzheimers Dis. 2020;74(2):545-561. doi: 10.3233/JAD-191163. J Alzheimers Dis. 2020. PMID: 32065794 Free PMC article.
-
Short-term erythropoietin treatment does not substantially modulate monocyte transcriptomes of patients with combined heart and renal failure.PLoS One. 2012;7(9):e41339. doi: 10.1371/journal.pone.0041339. Epub 2012 Sep 5. PLoS One. 2012. PMID: 22957013 Free PMC article. Clinical Trial.
-
The Pathway To Establishing HIV Latency Is Critical to How Latency Is Maintained and Reversed.J Virol. 2018 Jun 13;92(13):e02225-17. doi: 10.1128/JVI.02225-17. Print 2018 Jul 1. J Virol. 2018. PMID: 29643247 Free PMC article.
-
Review and Meta-Analyses of TAAR1 Expression in the Immune System and Cancers.Front Pharmacol. 2018 Jun 26;9:683. doi: 10.3389/fphar.2018.00683. eCollection 2018. Front Pharmacol. 2018. PMID: 29997511 Free PMC article.
-
Integrative analysis of methylome and transcriptome in human blood identifies extensive sex- and immune cell-specific differentially methylated regions.Epigenetics. 2015;10(10):943-57. doi: 10.1080/15592294.2015.1084462. Epigenetics. 2015. PMID: 26291385 Free PMC article.
References
-
- Murphy D. Gene expression studies using microarrays: principles, problems, and prospects. Adv Physiol Educ. 2000;26:256–270. - PubMed
Publication types
MeSH terms
Substances
LinkOut - more resources
Full Text Sources
Other Literature Sources
Molecular Biology Databases
