

A weighted average difference method for detecting differentially expressed genes from microarray data
- PMID: 18578891
- PMCID: PMC2464587
- DOI: 10.1186/1748-7188-3-8
A weighted average difference method for detecting differentially expressed genes from microarray data
Abstract
Background: Identification of differentially expressed genes (DEGs) under different experimental conditions is an important task in many microarray studies. However, choosing which method to use for a particular application is problematic because its performance depends on the evaluation metric, the dataset, and so on. In addition, when using the Affymetrix GeneChip(R) system, researchers must select a preprocessing algorithm from a number of competing algorithms such as MAS, RMA, and DFW, for obtaining expression-level measurements. To achieve optimal performance for detecting DEGs, a suitable combination of gene selection method and preprocessing algorithm needs to be selected for a given probe-level dataset.
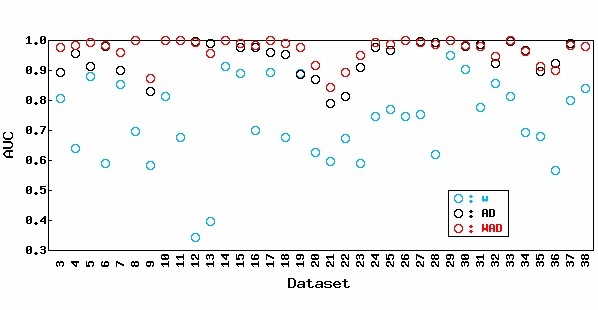
Results: We introduce a new fold-change (FC)-based method, the weighted average difference method (WAD), for ranking DEGs. It uses the average difference and relative average signal intensity so that highly expressed genes are highly ranked on the average for the different conditions. The idea is based on our observation that known or potential marker genes (or proteins) tend to have high expression levels. We compared WAD with seven other methods; average difference (AD), FC, rank products (RP), moderated t statistic (modT), significance analysis of microarrays (samT), shrinkage t statistic (shrinkT), and intensity-based moderated t statistic (ibmT). The evaluation was performed using a total of 38 different binary (two-class) probe-level datasets: two artificial "spike-in" datasets and 36 real experimental datasets. The results indicate that WAD outperforms the other methods when sensitivity and specificity are considered simultaneously: the area under the receiver operating characteristic curve for WAD was the highest on average for the 38 datasets. The gene ranking for WAD was also the most consistent when subsets of top-ranked genes produced from three different preprocessed data (MAS, RMA, and DFW) were compared. Overall, WAD performed the best for MAS-preprocessed data and the FC-based methods (AD, WAD, FC, or RP) performed well for RMA and DFW-preprocessed data.
Conclusion: WAD is a promising alternative to existing methods for ranking DEGs with two classes. Its high performance should increase researchers' confidence in microarray analyses.
Figures
References
LinkOut - more resources
Full Text Sources
