Comparative Study
. 2008 Jun 26;58(6):956-66.
doi: 10.1016/j.neuron.2008.04.026.

Cooperative nonlinearities in auditory cortical neurons

Affiliations
Comparative Study

Cooperative nonlinearities in auditory cortical neurons

Craig A Atencio et al. Neuron. .

Abstract

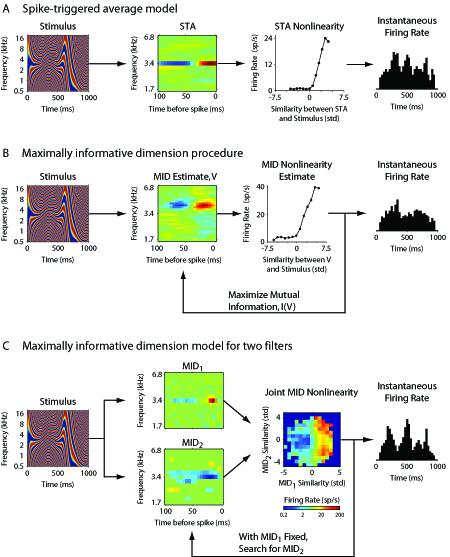
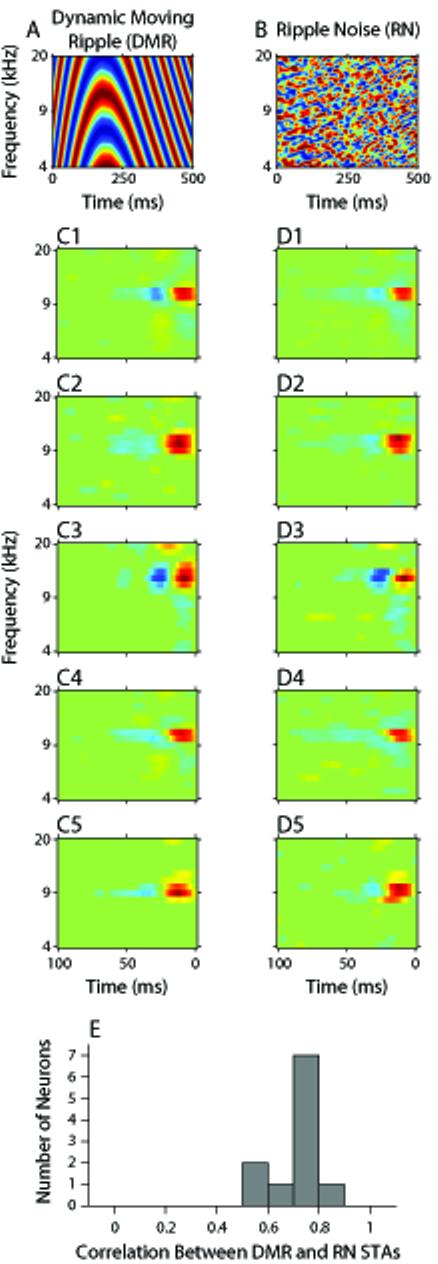
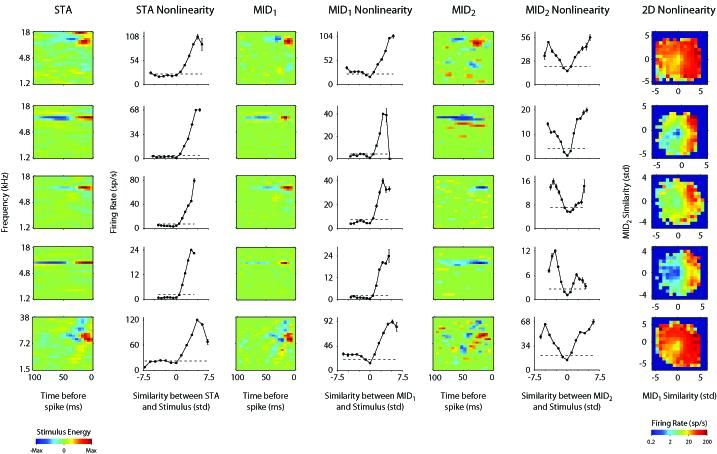
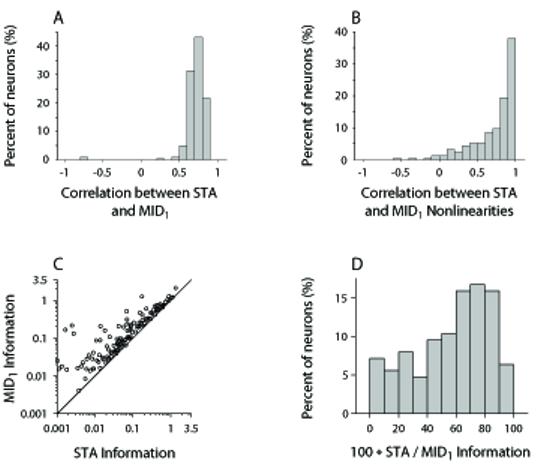
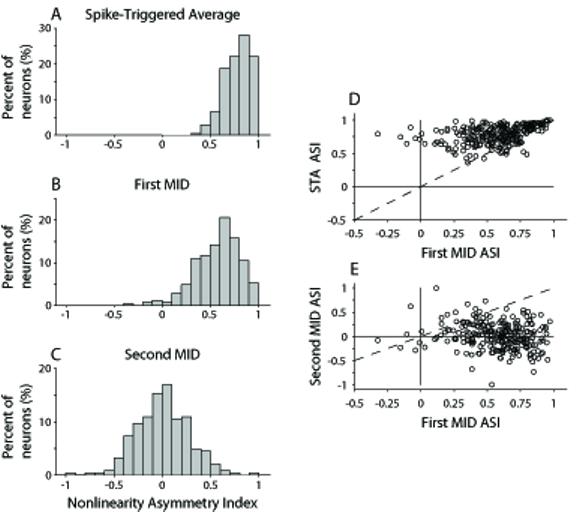
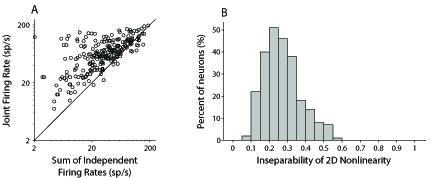
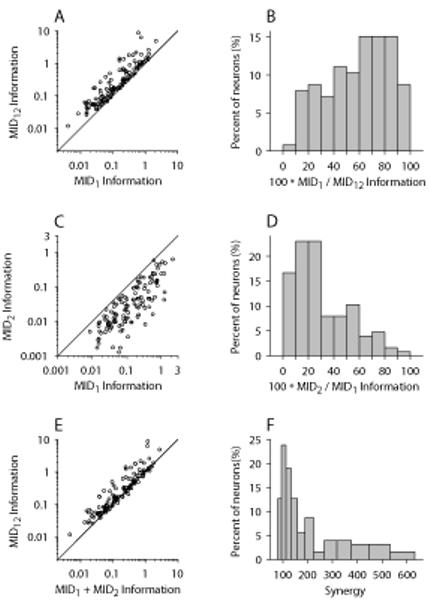
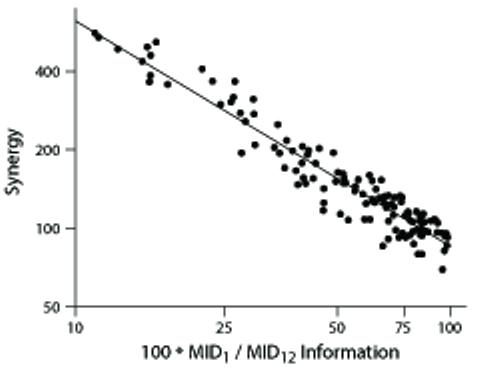
Cortical receptive fields represent the signal preferences of sensory neurons. Receptive fields are thought to provide a representation of sensory experience from which the cerebral cortex may make interpretations. While it is essential to determine a neuron's receptive field, it remains unclear which features of the acoustic environment are specifically represented by neurons in the primary auditory cortex (AI). We characterized cat AI spectrotemporal receptive fields (STRFs) by finding both the spike-triggered average (STA) and stimulus dimensions that maximized the mutual information between response and stimulus. We derived a nonlinearity relating spiking to stimulus projection onto two maximally informative dimensions (MIDs). The STA was highly correlated with the first MID. Generally, the nonlinearity for the first MID was asymmetric and often monotonic in shape, while the second MID nonlinearity was symmetric and nonmonotonic. The joint nonlinearity for both MIDs revealed that most first and second MIDs were synergistic and thus should be considered conjointly. The difference between the nonlinearities suggests different possible roles for the MIDs in auditory processing.


Figures

Figure 1
Figure 1
Schematic of models of AI receptive fields. (A) Spike-triggered average model. The stimulus (ordinate: frequency; abscissa: time) is processed by the STA, and the probability of a spike is determined by a nonlinearity, which describes the response strength as a function of the similarity between the stimulus and the STA. The nonlinearity abscissa is in units of standard deviation. Units are calculated with respect to the expected similarity between a random stimulus and the STA. High similarity values indicate increased stimulus selectivity. Responses in the histogram are illustrative. (B) Procedure used to calculate the MID model for a different neuron. For one MID, an iterative process is followed. A search is made for the feature, or filter, that maximizes the most mutual information between the stimulus and the spiking response. At each step of the iterative process the filter and the nonlinearity are estimated. (C) The two MID model. The procedure in (B) can be extended to find two MIDs. In this case, after the first MID is found, it is held fixed, and an additional search is made for a second MID. Each MID linearly filters the stimulus, and the rule that governs the strength of the response will then be two-dimensional. In the nonlinearity, red indicates an increase in response rate.
Figure 2
Figure 2
STAs obtained using stimuli with different statistics. (A) Short spectrotemporal segment of the dynamic moving ripple stimulus (DMR). (B) Short segment of the ripple noise stimulus (RN). (C1-C5) and (D1-D5): Example STAs for five neurons. Each row represents the STAs of one neuron in response to the dynamic moving ripple (C1-C5) and to the ripple noise stimulus (D1-D5). (E) Correlation between the dynamic moving ripple and ripple noise STAs. The STAs for the two stimuli were similar (mean correlation = 0.73; std = 0.079).
Figure 3
Figure 3
Example STAs, MIDs, and associated nonlinearities. Each row represents one neuron. STAs and MIDs in columns 1, 3, and 5 have frequency on the ordinate and time on the abscissa. Specific time-frequency patterns of stimulus energy lead to increased (red) or decreased (blue) responsiveness of each neuron, and may be interpreted as excitatory or inhibitory regions. One-dimensional nonlinearities are shown in columns 2, 4, 6. The ordinate represents the firing rate given the similarity between the stimulus and the filter. The dashed line represents the average firing rate over the complete stimulus presentation. Column 1: STAs have distinct excitatory and inhibitory regions. Column 2: STA nonlinearities were usually asymmetric. Column 3: first MIDs, which represent the stimulus feature that best accounts for the neuron’s responses, resembled the STAs, though the temporal duration of excitation/inhibition is often decreased due to the removal of stimulus correlations. Column 4: first MID nonlinearities were similar to STA nonlinearities, and were often asymmetric. Column 5: second MIDs revealed additional stimulus preferences, and were not well-predicted by the structure of the first MID. Column 6: second MID nonlinearities, which were usually symmetric, are structurally different from those of the first MIDs. Column 7: Two dimensional nonlinearities for the two MIDs. The ordinate/abscissa represents the similarity between the second/first MID and the stimulus. The color range (blue to red) indicates the response strength (low to high). Nonlinearities were not spatially uniform, indicating specific stimulus configurations lead to the largest response.
Figure 4
Figure 4
Comparison between STAs and first MIDs. (A) Correlation between the STA and MID1 filters. For most neurons the spectrotemporal structure of the STAs and first MIDs were highly correlated. (B) Correlation between the STA and MID nonlinearities. The structure of the STA and MID1 nonlinearities were also similar. (C) Comparison between the STA and MID mutual information (bits/spike). The first MID was able to account for more information than the STA. (D) Relative comparison of STA mutual information to that of the first MID (median = 63%).
Figure 5
Figure 5
Population analysis of 1D nonlinearity structure for STAs and MIDs. Asymmetry of the 1D nonlinearities was determined by comparing the values corresponding to positive similarities to those for negative similarities. Asymmetry Index values (ASIs) near +1 or -1 indicate highly asymmetric nonlinearities. ASIs near 0 indicate a symmetry. (A-C) Frequency histogram of the asymmetry of the nonlinearities. The STA and MID1 nonlinearities are highly asymmetric, while the MID2 nonlinearities were symmetric. (D) Comparison of STA and first MID nonlinearity structure. Most AI neurons that had an STA with an asymmetric nonlinearity also had an MID1 with a similarly structured nonlinearity. (E) Comparison of first and second MID nonlinearity structure. Auditory neurons usually had an MID1 nonlinearity that was asymmetric paired with an MID2 nonlinearity that was symmetric.
Figure 6
Figure 6
Population analysis of the structure of 2D nonlinearities. (A) Peak response rates in the two-dimensional nonlinearities are plotted against the sum of the peak rates in each of the MID1 and MID2 one-dimensional nonlinearities. For most neurons the joint nonlinearity contained a higher firing rate, indicating that special stimulus configurations may excite AI neurons in a manner that cannot be predicted by the independent processing of the MIDs. (B) Structural analysis of two-dimensional nonlinearities. The frequency histogram of the inseparability of the two-dimensional nonlinearities across all AI neurons is shown. Inseparability index values near 0 indicate that the 2D nonlinearity can be approximated by a product of two 1D nonlinearities. For most AI neurons this approximation was inappropriate, as indicated by the non-zero mode of the distribution, implying that the joint stimulus processing of the two MIDs contains more information than the independent processing of each MID.
Figure 7
Figure 7
Population analysis of information processing of Maximally Informative Dimensions. (A) Comparison of mutual information (bits/spike) for the two MID model versus the one MID model. The two MID model (ordinate) always accounted for more information than the single MID model (abscissa). (B) Frequency histogram of the relative contribution of the first MID to the two MID model information. The MID1 accounted for approximately 62% of the information in the combined model. (C) Comparison between the first MID and second MID information. The MID1 information was greater than the MID2 information. (D) Frequency histogram of the relative comparison between the first and second MID information. The MID2 information was approximately 30% of the MID1 information. (E) Comparison between the information of the two MID model when the filters process stimuli jointly versus independently. The combined, joint processing model accounted for more information than a model of two independently processing MIDs. (F) Frequency histogram of the cooperative processing, or synergy, of the two MIDs. The median synergy between the MIDs was 128%; for 37% of neurons it exceeded 150%.
Figure 8
Figure 8
Comparison between synergy and first MID contribution. Ordinate: synergy. Abscissa: ratio of the first MID information to the two MID information. The correlation between the data points was significant (r=-0.96, p<0.01, t-test).

Comment in

Similar articles

Cited by

References

    1. Adelman TL, Bialek W, Olberg RM. The information content of receptive fields. Neuron. 2003;40:823–833. - PubMed
    1. Adelson EH, Bergen JR. Spatiotemporal energy models for the perception of motion. J Opt Soc Am A. 1985;2:284–299. - PubMed
    1. Aertsen A, Johannesma PI. Spectro-temporal receptive fields of auditory neurons in the grassfrog. I. Characterization of tonal and natural stimuli. Biol Cybern. 1980;38:223–234. - PubMed
    1. Aguera y, Arcas B, Fairhall AL, Bialek W. Computation in a single neuron: Hodgkin and Huxley revisited. Neural Comput. 2003;15:1715–1749. - PubMed
    1. Bain LJ, Engelhardt M. Introduction to Probability and Mathematical Statistics. Second Edition PWS-KENT; Boston: 1992.

Publication types

LinkOut - more resources