

Microarray analysis of perichondral and reserve growth plate zones identifies differential gene expressions and signal pathways
- PMID: 18579462
- PMCID: PMC2569855
- DOI: 10.1016/j.bone.2008.04.021
Microarray analysis of perichondral and reserve growth plate zones identifies differential gene expressions and signal pathways
Abstract
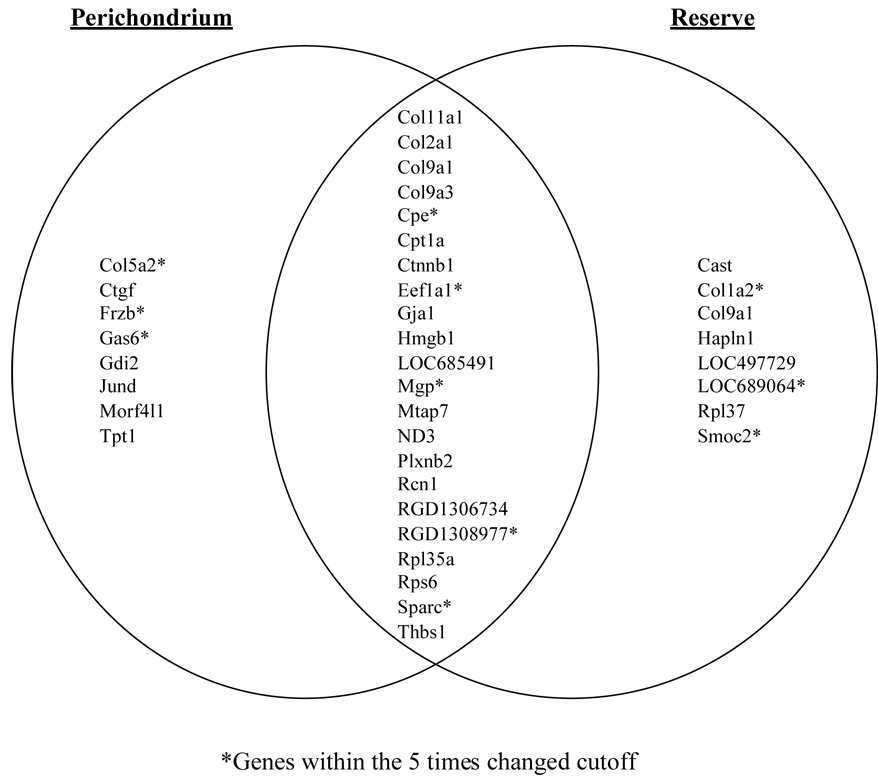
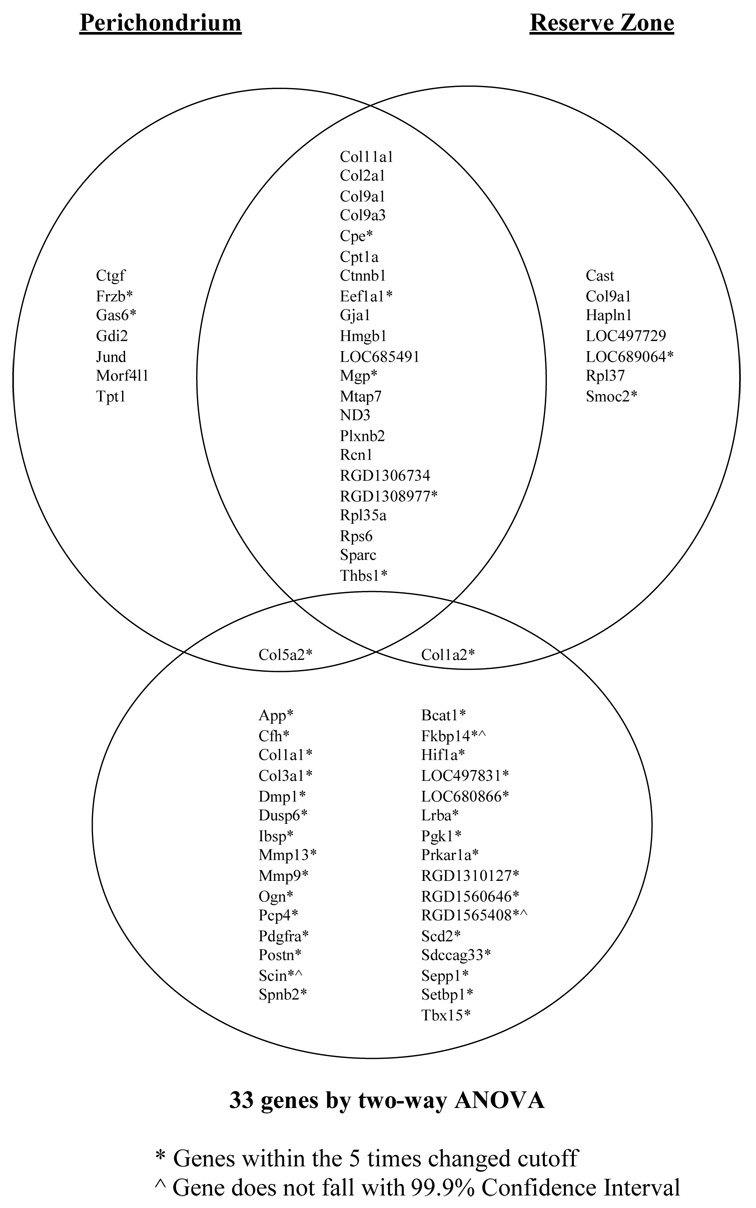
In the growth plate, the reserve and perichondral zones have been hypothesized to have similar functions, but their exact functions are poorly understood. Our hypothesis was that significant differential gene expression exists between perichondral and reserve chondrocytes that may differentiate the respective functions of these two zones. Normal Sprague-Dawley rat growth plate chondrocytes from the perichondral zone (PC) and reserve zone (RZ) were isolated by laser microdissection and then subjected to microarray analysis. In order to most comprehensively capture the unique features of the two zones, we analyzed both the most highly expressed genes and those that were most significantly different from the proliferative zone (PZ) as a single comparator. Confirmation of the differential expression of selected genes was done by quantitative real-time RT-PCR. A total of 8 transcripts showing high expression unique to the PC included translationally-controlled tumor protein (Tpt1), connective tissue growth factor (Ctgf), mortality factor 4 (Morf4l1), growth arrest specific 6 (Gas6), type V procollagen (Col5a2), frizzled-related protein (Frzb), GDP-dissociation inhibitor 2 (Gdi2) and Jun D proto-oncogene (Jund). In contrast, 8 transcripts showing unique high expression in the RZ included hyaluronan and proteoglycan link protein 1 (Hapln1), hemoglobin beta-2 subunit, type I procollagen (Col1a2), retinoblastoma binding protein 4 (LOC685491), Sparc-related modular calcium binding 2 (Smoc2), and calpastatin (Cast). Other genes were highly expressed in cells from both PC and RZ zones, including collagen II, collagen IX, catenin (cadherin associated protein) beta 1, eukaryotic translation elongation factor, high mobility group, ribosomal protein, microtubule-associated protein, reticulocalbin, thrombospondin, retinoblastoma binding protein, carboxypeptidase E, carnitine palmitoyltransferase 1, cysteine rich glycoprotein, plexin B2 (Plxnb2), and gap junction membrane channel protein. Functional classification of the most highly expressed transcripts were analyzed, and the pathway analysis indicated that ossification, bone remodeling, and cartilage development were uniquely enriched in the PC whereas both the PC and RZ showed pathway enrichment for skeletal development, extracellular matrix structural constituent, proteinaceous extracellular matrix, collagen, extracellular matrix, and extracellular matrix part pathways. We conclude that differential gene expression exists between the RZ and PC chondrocytes and these differentially expressed genes have unique roles to play corresponding to the function of their respective zones.
Figures
Similar articles
-
Microarray analysis of proliferative and hypertrophic growth plate zones identifies differentiation markers and signal pathways.Bone. 2004 Dec;35(6):1273-93. doi: 10.1016/j.bone.2004.09.009. Bone. 2004. PMID: 15589209
-
Microarray cluster analysis of irradiated growth plate zones following laser microdissection.Int J Radiat Oncol Biol Phys. 2009 Jul 1;74(3):949-56. doi: 10.1016/j.ijrobp.2008.10.009. Int J Radiat Oncol Biol Phys. 2009. PMID: 19480974 Free PMC article.
-
Microarray analysis of irradiated growth plate zones following laser microdissection shows later importance of differentially expressed genes during radiorecovery.Cells Tissues Organs. 2010;192(4):240-9. doi: 10.1159/000318644. Epub 2010 Jul 8. Cells Tissues Organs. 2010. PMID: 20616531 Free PMC article.
-
Gradients in bone morphogenetic protein-related gene expression across the growth plate.J Endocrinol. 2007 Apr;193(1):75-84. doi: 10.1677/joe.1.07099. J Endocrinol. 2007. PMID: 17400805
-
Chondrocyte channel transcriptomics: do microarray data fit with expression and functional data?Channels (Austin). 2013 Nov-Dec;7(6):459-67. doi: 10.4161/chan.26071. Epub 2013 Aug 30. Channels (Austin). 2013. PMID: 23995703 Free PMC article. Review.
Cited by
-
Evidence That Rat Chondrocytes Can Differentiate Into Perichondrial Cells.JBMR Plus. 2018 Jun 7;2(6):351-361. doi: 10.1002/jbm4.10056. eCollection 2018 Nov. JBMR Plus. 2018. PMID: 30460338 Free PMC article.
-
Functional Roles of Connexins and Gap Junctions in Osteo-Chondral Cellular Components.Int J Mol Sci. 2023 Feb 19;24(4):4156. doi: 10.3390/ijms24044156. Int J Mol Sci. 2023. PMID: 36835567 Free PMC article. Review.
-
Changes in matrix protein gene expression associated with mineralization in the differentiating chick limb-bud micromass culture system.J Cell Biochem. 2011 Feb;112(2):607-13. doi: 10.1002/jcb.22951. J Cell Biochem. 2011. PMID: 21268082 Free PMC article.
-
Gap junctions and hemichannels in signal transmission, function and development of bone.Biochim Biophys Acta. 2012 Aug;1818(8):1909-18. doi: 10.1016/j.bbamem.2011.09.018. Epub 2011 Sep 22. Biochim Biophys Acta. 2012. PMID: 21963408 Free PMC article. Review.
-
Molecular genetic studies of gene identification for osteoporosis: the 2009 update.Endocr Rev. 2010 Aug;31(4):447-505. doi: 10.1210/er.2009-0032. Epub 2010 Mar 31. Endocr Rev. 2010. PMID: 20357209 Free PMC article. Review.
References
-
- Ballock RT, O’Keefe RJ. Physiology and pathophysiology of the growth plate. Birth Defects Res Part C Embryo Today. 2003;69:123–143. - PubMed
-
- der Eerden BC, Karperien M, Wit JM. Systemic and local regulation of the growth plate. Endocr Rev. 2003;24:782–801. - PubMed
-
- Kronenberg HM. Developmental regulation of the growth plate. Nature. 2003;423:332–336. - PubMed
-
- Rabie AB, Tang GH, Xiong H, Hagg U. PTHrP regulates chondrocyte maturation in condylar cartilage. J Dent Res. 2003;82:627–631. - PubMed
-
- Schipani E, Provot S. PTHrP, PTH, and the PTH/PTHrP receptor in endochondral bone development. Birth Defects Res Part C Embryo Today. 2003;69:352–362. - PubMed
Publication types
MeSH terms
Substances
Grants and funding
LinkOut - more resources
Full Text Sources
Other Literature Sources
Molecular Biology Databases
Research Materials
Miscellaneous
