. 2008 Aug 29;283(35):24254-63.
doi: 10.1074/jbc.M803549200. Epub 2008 Jun 25.

Increased mobility of major histocompatibility complex I-peptide complexes decreases the sensitivity of antigen recognition

Affiliations

Increased mobility of major histocompatibility complex I-peptide complexes decreases the sensitivity of antigen recognition

Jean-Manuel Segura et al. J Biol Chem. .

Abstract

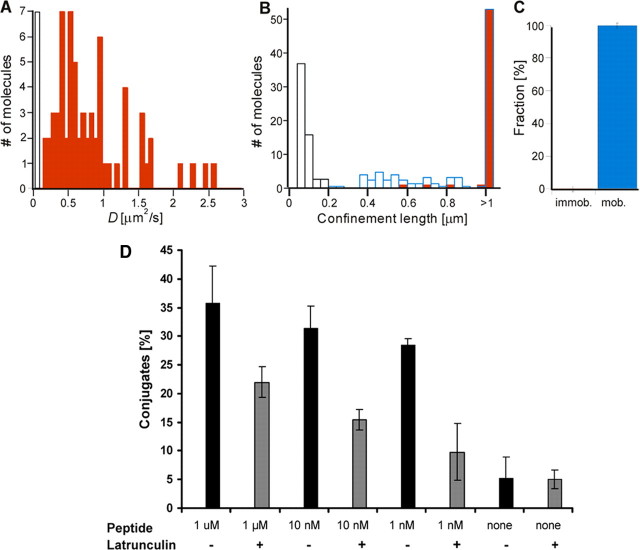
CD8(+) cytotoxic T lymphocytes (CTL) can recognize and kill target cells expressing only a few cognate major histocompatibility complex (MHC) I-peptide complexes. This high sensitivity requires efficient scanning of a vast number of highly diverse MHC I-peptide complexes by the T cell receptor in the contact site of transient conjugates formed mainly by nonspecific interactions of ICAM-1 and LFA-1. Tracking of single H-2K(d) molecules loaded with fluorescent peptides on target cells and nascent conjugates with CTL showed dynamic transitions between states of free diffusion and immobility. The immobilizations were explained by association of MHC I-peptide complexes with ICAM-1 and strongly increased their local concentration in cell adhesion sites and hence their scanning by T cell receptor. In nascent immunological synapses cognate complexes became immobile, whereas noncognate ones diffused out again. Interfering with this mobility modulation-based concentration and sorting of MHC I-peptide complexes strongly impaired the sensitivity of antigen recognition by CTL, demonstrating that it constitutes a new basic aspect of antigen presentation by MHC I molecules.


Figures

FIGURE 1.
FIGURE 1.
Single molecule microscopy of Kd-peptide P1 complexes on L-Kd cells. A, 51Cr-labeled L-Kd cells were pulsed with the indicated concentrations of PbCS (circles), PbCS(ABA) (squares), peptide P1 (triangles), or peptide P2 (crosses) and incubated with cloned S14 CTL (CTL/target = 3/1). After 4 h, the specific lysis was determined from released 51Cr. One representative experiment out of three is shown. B, image of Kd-peptide P1 complexes on the lower glass-adhered membrane of two L-Kd cells (contoured by dashed lines) within an illuminated circular region of 20 μm. Single complexes exhibit diffraction-limited spots, like the one encircled. The scale bar is 5 μm. C, single molecule trace displaying typical single-step photobleaching. D-F, typical trajectories of an immobile/confined complex (D), a mobile one (E), and one undergoing a transition from an immobile/confined to a mobile state (F). The pixel size is 225 nm.
FIGURE 2.
FIGURE 2.
Trajectories of single Kd-peptide P1 complexes on L-Kd cells. A-C, diffusion of Kd-peptide complexes on the lower substrate-adhered cell membrane. A, diffusion coefficients (D) of single Kd-peptide complexes (red bars; 96 molecules on 12 different cells). B, confinement length (L) for single Kd-peptide complexes (red bars). Molecules with L >1 μm are represented in a bar at >1 μm. Blue bars represent L of complexes following simulated Brownian diffusion and were normalized such that the bars at >1 μm are identical. ATTO molecules immobilized on glass were analyzed the same way (black bars). C, using length of 360 nm as threshold shows that 42 ± 10% of the molecules were immobile/confined and 58 ± 10% mobile (mean value ± 95% confidence interval). The errors in the histogram indicate standard errors. D-F, diffusion of complexes on the upper cell membrane. D, diffusion coefficients (D) of single complexes (red bars; 87 molecules on 27 different cells). E, histogram of length (red bars). Complexes with length >1 μm are represented in a bar at >1 μm. Black bars represent glass slide-immobilized ATTO molecules and blue bars complexes following simulated Brownian diffusion. F, using length of 360 nm as threshold shows that 13 ± 7% of the complexes were immobile/confined and 88 ± 7% mobile. G, bars on the left side represent transitions from mobile to immobile normalized (100% referring to the total number of steps for all mobile molecules) and on the right side transitions of immobile to mobile (100% referring to the total number of steps summed over all immobile molecules). H-I, confocal images of L-Kd cells stained with FITC-phalloidin on the lower membrane (H) or on a median section (I). Scale bars are 10 μm.
FIGURE 3.
FIGURE 3.
Disruption of the cytoskeleton increases the mobility of Kd-peptide P1 complexes and decreases recognition by S14 CTL. A, diffusion coefficients (D) of complexes on the upper surface of latrunculin-treated L-Kd cells. B, confinement length (L) of the complexes (red bars; 67 molecules on 10 different cells); complexes with length >1 μm are represented in a bar at >1 μm. Black bars represent immobilized ATTO molecules and blue bars molecules following simulated Brownian diffusion. C, all complexes (100 ± 3%) were mobile. D, indo-1-labeled S14 CTL were incubated at 37 °C for 1 min with CFSE labeled L-Kd cells (CTL/target = 1/1) that were sensitized with the indicated concentrations of peptide P1 and pretreated (gray bars) or not (black bars) with latrunculin. The percentage of Indo-1 and CFSE-positive conjugates was analyzed by flow cytometry. Mean values and S.D. were calculated from four experiments.
FIGURE 4.
FIGURE 4.
Trajectories of single Kd-peptide P1 complexes on RMA-S-Kd cells. A, diffusion coefficients (D) of single complexes (red bars, 94 molecules on 17 different cells). B, histogram of the confinement lengths (L) of complexes (red bars). Complexes with length >1 μm are represented by a bar at >1 μm. Black bars represent immobilized ATTO molecules and blue bars molecules following simulated Brownian diffusion. C, using length of 360 nm as threshold showed that 16 ± 8% of the molecules were confined, and 84 ± 8% were mobile. D-F, Kd-peptide P1 complexes on RMA-S-KdGPI cells. D, diffusion coefficients (D) of single complexes (red bars, 100 molecules on 18 different cells). E, confinement lengths (L)(red bars). Complexes with length of >1 μm are represented in a bar at >1 μm. F, using the length of 360 nm as threshold shows that 1 ± 2% of the molecules were confined and 99 ± 2% mobile.
FIGURE 5.
FIGURE 5.
GPI-linked Kd-peptide P1 complexes are less efficiently recognized. A, RMA-S-Kd cells (squares), RMA-S-KdGPI (circles), or untransfected RMA-S cells (triangles) were incubated with the indicated concentrations of PbCS(biotin) peptide at 37 °C for 1 h, and the peptide binding was assessed by flow cytometry as mean fluorescent intensity (MFI). B, alternatively, RMA-S-Kd cells (open symbols) were incubated at 32 °C with graded concentrations of PbCS(biotin) peptide for 30 min (open squares), 60 min (open circles), or 90 min (open diamonds). For RMA-S-KdGPI cells (closed symbols), the incubations were performed at 37 °C for 1 min (filled triangles), 5 min (filled diamonds), and 10 min (filled squares). One out of four experiments is shown. B, RMA-S-Kd cells (squares) were incubated at 32 °C for 90 min and RMA-S-KdGPI cells (triangles) at 37 °C for 5 min with graded concentrations of PbCS(ABA) peptide and their recognition by cloned S14 CTL assessed in a 51Cr release assay. One out of three experiments is shown.
FIGURE 6.
FIGURE 6.
Kd-peptide P1 complexes in the immunological synapse between a L-Kd cell and a S14 CTL. A, transmission micrograph of an L-Kd cell-S14 CTL conjugate. B and C, actin staining with FITC-phalloidin (B) and ATTO647 fluorescence image of the same conjugate (C). Scale bars are 10 μm. D, diffusion coefficients (D) of single Kd-peptide P1 complexes (red bars, 37 molecules in 19 different synapses). E, confinement length (L) of single Kd-peptide complexes (red bars). Black bars represent glass immobilized ATTO molecules. F, 100 ± 6% of the complexes were immobile.
FIGURE 7.
FIGURE 7.
Single molecule microscopy of Kd-peptide P2 complexes in the synapse between an L-Kd cell and an S14 CTL. A, transmission and overlaid Fluo-3 fluorescence micrograph image. B, corresponding ATTO647 fluorescence image. Scale bars are 5 μm. C, trajectories of Kd-peptide P2 complexes in synapse exhibited reversible confinements followed by free diffusion (1 and 2), free diffusion (3), confinement (4, apparent domain size of 280 nm), or immobility (5, apparent confinement of 140 nm). Scale bar is 500 nm. D, diffusion coefficients (D) of single complexes (red bars, 49 molecules in 12 different synapses). E, confinement lengths (L) of single complexes (red bars). Complexes with length >1 μm are represented in a bar at >1 μm. Blue bars represent complexes following simulated Brownian diffusion, and black bars represent ATTO molecules immobilized on a coverslip. F, using the length of 360 nm as threshold showed that 56 ± 15% of the Kd-peptide complexes were immobile/confined.

Similar articles

Cited by

References

    1. Sykulev, Y., Joo, M., Vturina, I., Tsomides, T. J., and Eisen, H. N. (1996) Immunity 4 565-571 - PubMed
    1. Purbhoo, M. A., Irvine, D. J., Huppa, J. B., and Davis, M. M. (2004) Nat. Immunol. 5 524-530 - PubMed
    1. Marwali, M. R., MacLeod, M. A., Muzia, D. N., and Takei, T. (2004) J. Immunol. 173 2960-2967 - PubMed
    1. Somersalo, K., Anikeeva, N., Sims, T. N., Thomas, V. K., Strong, R. K., Spies, T., Lebedeva, T., Sykulev, Y., and Dustin, M. L. (2004) J. Clin. Invest. 113 49-57 - PMC - PubMed
    1. Suzuki, J., Yamasaki, S., Wu, J., Koretzky, G. J., and Saito, T. (2007) Blood 109 168-175 - PubMed

Publication types