. 2008 Sep;82(17):8629-46.
doi: 10.1128/JVI.00616-08. Epub 2008 Jun 25.

Linker histones are mobilized during infection with herpes simplex virus type 1

Affiliations

Linker histones are mobilized during infection with herpes simplex virus type 1

Kristen L Conn et al. J Virol. 2008 Sep.

Abstract

Histones interact with herpes simplex virus type 1 (HSV-1) genomes and localize to replication compartments early during infections. However, HSV-1 genomes do not interact with histones in virions and are deposited in nuclear domains devoid of histones. Moreover, late viral replication compartments are also devoid of histones. The processes whereby histones come to interact with HSV-1 genomes, to be later displaced, remain unknown. However, they would involve the early movement of histones to the domains containing HSV-1 genomes and the later movement away from them. Histones unbind from chromatin, diffuse through the nucleoplasm, and rebind at different sites. Such mobility is upregulated by, for example, phosphorylation or acetylation. We evaluated whether HSV-1 infection modulates histone mobility, using fluorescence recovery after photobleaching. All somatic H1 variants were mobilized to different degrees. H1.2, the most mobilized, was mobilized at 4 h and further so at 7 h after infection, resulting in increases in its "free" pools. H1.2 was mobilized to a "basal" degree under conditions of little to no HSV-1 protein expression. This basal mobilization required nuclear native HSV-1 genomes but was independent of HSV-1 proteins and most likely due to cellular responses. Mobilization above this basal degree, and increases in H1.2 free pools, however, depended on immediate-early or early HSV-1 proteins, but not on HSV-1 genome replication or late proteins. Linker histone mobilization is a novel consequence of cell-virus interactions, which is consistent with the dynamic interactions between histones and HSV-1 genomes during lytic infection; it may also participate in the regulation of viral gene expression.


Figures
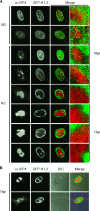
FIG. 1.
FIG. 1.
Expression of ICP4 as nuclear diffuse or accumulated into replication compartments in Vero cells expressing GFP-H1.2. Digital fluorescent micrographs show Vero cells expressing GFP-H1.2 and stained with anti-ICP4 (α-ICP4) antibodies. Cells were transfected with plasmids expressing GFP fused to H1.2 and infected with 30 PFU/cell of HSV-1 strain KOS. Cells were fixed at 4.5 (4) or 7.5 (7) hpi as indicated and stained for ICP4. Single (anti-ICP4 [α-ICP4], GFP-H1.2, and differential interference contrast [DIC]) and merged images are shown. (A) Cells with ICP4 expressed as nuclear diffuse (ND) or replication compartments (RC). Right-most panels, 16× digital enlargement of the regions indicated by the boxes on the left-most merge images, highlighting the colocalization of H1.2 and ICP4 signals (pixels in different shades of yellow and orange). (B) Cells showing strictly nuclear localization of GFP-H1.2 regardless of whether the ICP4 signal is nuclear (top) or nuclear and cytoplasmic (bottom). The GFP-H1.2 images were overexposed to highlight the lack of cytoplasmic signal.
FIG. 2.
FIG. 2.
ICP4 expression and accumulation into replication compartments in Vero cells expressing or not expressing GFP-H1 somatic variants. The bar graphs show the percentage of HSV-1-infected cells transfected with each GFP-H1 somatic variant and expressing ICP4 as nuclear diffuse or accumulated into replication compartments. Vero cells were transfected with plasmids expressing GFP fused to each H1 somatic variant (H10, H1.1, H1.2, H1.3, H1.4, and H1.5), infected with 30 PFU/cell HSV-1 strain KOS, fixed at 4.5 (4) or 7.5 (7) hpi, and stained for ICP4. Nuclear expression of ICP4 and accumulation into replication compartments (Fig. 1) in cells in which GFP-H1 was expressed (+) or not (−) was evaluated by fluorescence microscopy.
FIG. 3.
FIG. 3.
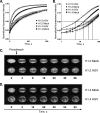
Somatic linker histone variants are differentially mobilized in HSV-1-infected cells. (A) Line graphs representing the normalized fluorescence intensity of the photobleached nuclear region versus time. Vero cells were transfected with plasmids expressing GFP fused to H1.2 or H1.4. Transfected cells were mock infected or infected with 30 PFU/cell of HSV-1 strain KOS. Nuclear mobility of each GFP-H1 variant was examined from 7 to 8 hpi by FRAP. Error bars indicate the standard errors of the means (n ≥ 15); time is plotted on a linear scale. (B) The same data as in panel A, presented on a semilogarithmic scale. Lines indicate the times when 50% of the original relative fluorescence was recovered (T50). (C and D) Composite images of Vero cells expressing GFP-H1.2 (C) or GFP-H1.4 (D) infected as described for panel A. Images were collected prior to (time zero) or at the indicated times after photobleaching.
FIG. 4.
FIG. 4.
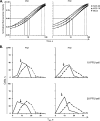
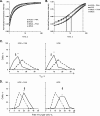
H1.2 mobilization increases with multiplicity of infection and time after infection. (A) Line graphs representing the normalized fluorescence intensity of the photobleached nuclear region over time. Vero cells were transfected with plasmids expressing GFP-H1.2 and mock infected or infected with 10 or 30 PFU/cell of HSV-1 strain KOS. Nuclear mobility of GFP-H1.2 was examined from 4 to 5 hpi (4 hpi) or 7 to 8 hpi (7 hpi) by FRAP. Solid or dashed lines are the times when 50 or 90% of the original relative fluorescence was recovered (T50 or T90), respectively. Mock-infected cells had not recovered 90% of the original relative fluorescence when the measurements were stopped at 100 s. (B) Frequency distribution plots of the T50 per individual cell as evaluated by FRAP. Dashed or solid lines, mock-infected or HSV-1 strain KOS-infected cells, respectively; arrows, mean T50 of the infected cell population (n ≥ 14).
FIG. 5.
FIG. 5.
The pool of free H1.2 increases during infection. Frequency distribution plot of the percentage of free H1.2 per individual cell. Vero (A) or U2OS (B) cells were transfected with plasmids expressing GFP-H1.2. Transfected cells were mock infected (dashed line) or infected (solid line) with the indicated multiplicity of HSV-1 strain KOS, n212, KM110, or UV-inactivated KOS. Free GFP-H1.2 was evaluated from 4 to 5 hpi (4 hpi) or 7 to 8 hpi (7 hpi) by FRAP (n ≥ 17). **, P < 0.01; *, P < 0.05.
FIG. 6.
FIG. 6.
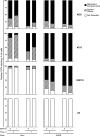
ICP4 expression and accumulation into replication compartments in Vero or U2OS cells infected with wild-type or mutant HSV-1 strains. Bar graphs representing the percentage of HSV-1-infected cells transfected with GFP-H1.2 and expressing ICP4 as nuclear diffuse or accumulated into replication compartments. Vero or U2OS cells were transfected with plasmids expressing GFP-H1.2. Cells were infected with 30 PFU/cell of HSV-1 strain KOS, n212, KM110, or UV-inactivated KOS or with 6 PFU/cell of HSV-1 strain KOS (U2OS cells only). Cells were fixed at 4.5 (4) or 7.5 (7) hpi and stained for ICP4. Nuclear expression of ICP4 and accumulation into replication compartments in cells in which GFP-H1.2 was expressed (+) or not (−) were evaluated by fluorescence microscopy.
FIG. 7.
FIG. 7.
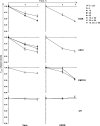
Mobilization of H1.2 requires nuclear HSV-1 genomes but not ICP0 or VP16. Line graphs representing the average H1.2 T50 in HSV-1-infected cells normalized to mock-infected cells and plotted against time postinfection. Vero or U2OS cells were transfected with plasmids expressing GFP-H1.2. Transfected cells were mock infected or infected with 6, 10, 30, 60, 10 to 30, 30 to 60, or 10 to 60 PFU/cell of HSV-1 strain KOS, n212, KM110, or UV-inactivated KOS. Nuclear mobility of GFP-H1.2 was examined from 4 to 5 hpi (4) or 7 to 8 hpi (7) by FRAP. Error bars, standard errors of the means (n ≥ 25), except for Vero KOS 10 at 4 and 7 hpi, Vero n212 60 at 4 and 7 hpi, U2OS KOS 6 at 4 hpi, U2OS KM110 10 at 4 and 7 hpi, and U2OS KM110 30 at 7 hpi (n ≥ 14). Vero KOS data are a summary of the data presented in Fig. 4.
FIG. 8.
FIG. 8.
Enhanced H1.2 mobilization or increased free H1.2 do not require HSV-1 genome replication. (A) Line graphs representing the normalized fluorescence intensity of the photobleached nuclear region over time. Vero cells were transfected with plasmids expressing GFP-H1.2, and mock infected or infected with 30 PFU/cell of HSV-1 strain KOS in the presence of 400 μg/ml of PAA or no drug (data from Fig. 4A were replotted for comparison). Nuclear mobility of GFP-H1.2 was examined from 7 to 8 hpi by FRAP. Error bars, standard errors of the means (n ≥ 18); time is plotted on a linear scale. (B) The same data as in panel A, plotted on a semilogarithmic scale. Solid or dashed lines, times when 50 or 90% of the original relative fluorescence was recovered (T50 or T90), respectively. Mock-infected cells had not recovered 90% of the original relative fluorescence when the measurements were stopped at 100 s. (C) Frequency distribution plot of the T50 per individual cell evaluated by FRAP as described for panel A. Dashed or solid lines, mock-infected or HSV-1 (30 PFU/cell strain KOS)-infected cells treated with 400 μg/ml of PAA or no drug (data from Fig. 4B were replotted for comparison). Arrows, mean T50 of the infected cell population. (D) Frequency distribution plot of the percentage of free H1.2 per individual cell evaluated by FRAP as described for panel A. Dashed or solid lines, mock-infected or HSV-1 (30 PFU/cell strain KOS)-infected cells treated with 400 μg/ml of PAA or no drug (data from Fig. 5A were replotted for comparison). Arrow, mean percentage of free H1.2 per cell of the infected cell population; **, P < 0.01.

Similar articles

Cited by

References

    1. Arthur, J. L., C. G. Scarpini, V. Connor, R. H. Lachmann, A. M. Tolkovsky, and S. Efstathiou. 2001. Herpes simplex virus type 1 promoter activity during latency establishment, maintenance, and reactivation in primary dorsal root neurons in vitro. J. Virol. 753885-3895. - PMC - PubMed
    1. Ascoli, C. A., and G. G. Maul. 1991. Identification of a novel nuclear domain. J. Cell Biol. 112785-795. - PMC - PubMed
    1. Cai, W., and P. A. Schaffer. 1992. Herpes simplex virus type 1 ICP0 regulates expression of immediate-early, early, and late genes in productively infected cells. J. Virol. 662904-2915. - PMC - PubMed
    1. Cai, W. Z., and P. A. Schaffer. 1989. Herpes simplex virus type 1 ICP0 plays a critical role in the de novo synthesis of infectious virus following transfection of viral DNA. J. Virol. 634579-4589. - PMC - PubMed
    1. Catez, F., D. T. Brown, T. Misteli, and M. Bustin. 2002. Competition between histone H1 and HMGN proteins for chromatin binding sites. EMBO Rep. 3760-766. - PMC - PubMed

Publication types

Substances