. 2008 Sep;295(3):F789-802.
doi: 10.1152/ajprenal.90227.2008. Epub 2008 Jun 25.

Renal Na+-K+-Cl- cotransporter activity and vasopressin-induced trafficking are lipid raft-dependent

Affiliations

Renal Na+-K+-Cl- cotransporter activity and vasopressin-induced trafficking are lipid raft-dependent

Pia Welker et al. Am J Physiol Renal Physiol. 2008 Sep.

Abstract

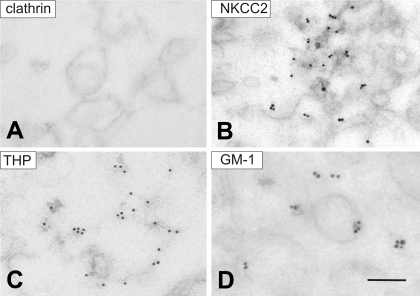
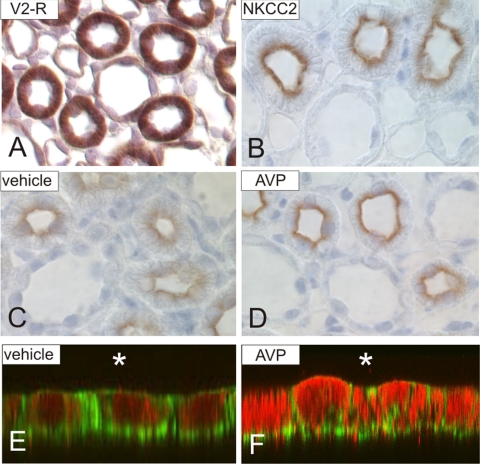
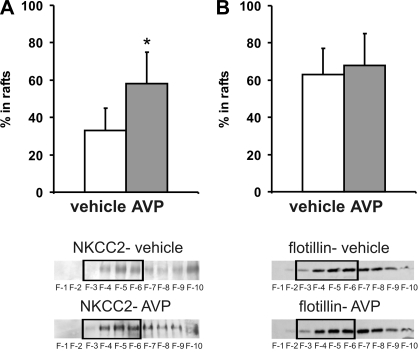
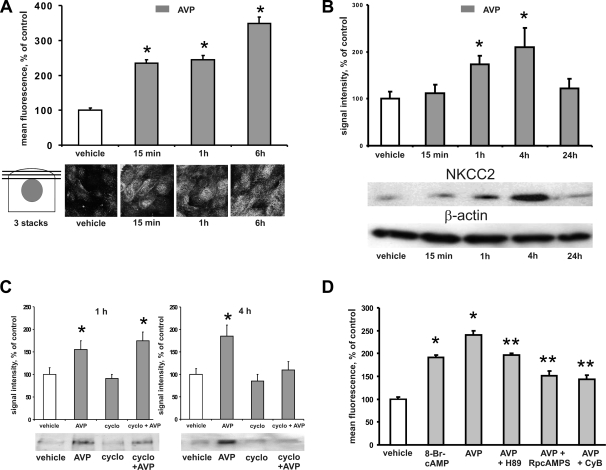
Apical bumetanide-sensitive Na(+)-K(+)-2Cl(-) cotransporter (NKCC2), the kidney-specific member of a cation-chloride cotransporter superfamily, is an integral membrane protein responsible for the transepithelial reabsorption of NaCl. The role of NKCC2 is essential for renal volume regulation. Vasopressin (AVP) controls NKCC2 surface expression in cells of the thick ascending limb of the loop of Henle (TAL). We found that 40-70% of Triton X-100-insoluble NKCC2 was present in cholesterol-enriched lipid rafts (LR) in rat kidney and cultured TAL cells. The related Na(+)-Cl(-) cotransporter (NCC) from rat kidney was distributed in LR as well. NKCC2-containing LR were detected both intracellularly and in the plasma membrane. Bumetanide-sensitive transport of NKCC2 as analyzed by (86)Rb(+) influx in Xenopus laevis oocytes was markedly reduced by methyl-beta-cyclodextrin (MbetaCD)-induced cholesterol depletion. In TAL, short-term AVP application induced apical vesicular trafficking along with a shift of NKCC2 from non-raft to LR fractions. In parallel, increased colocalization of NKCC2 with the LR ganglioside GM1 and their polar translocation were assessed by confocal analysis. Apical biotinylation showed twofold increases in NKCC2 surface expression. These effects were blunted by mevalonate-lovastatin/MbetaCD-induced cholesterol deprivation. Collectively, these findings demonstrate that a pool of NKCC2 distributes in rafts. Results are consistent with a model in which LR mediate polar insertion, activity, and AVP-induced trafficking of NKCC2 in the control of transepithelial NaCl transport.


Figures

Fig. 1.
Fig. 1.
Cytochemistry and RT-PCR characterize rabbit cells of the thick ascending limb of the loop of Henle (rbTAL) cell monolayers as used in lipid raft (LR) studies. A–C: conventional immunofluorescence shows Na+-K+-Cl cotransporter 2 (NKCC2; red) in a widespread distribution across the cell; cell borders are zonula occludens (ZO)-1-positive (green), nuclei are 4,6-diamidino-2-phenylindole (DAPI)-stained (blue). D–F: preincubation peptide blockade (10-fold excess) of the antibody against NKCC2 reveals near-total absence of specific signal. G and H: RT-PCR showing the presence of mRNA coding for NKCC2 and its 3 isoforms (F, B, and A) with specific, distinct primers and of vasopressin receptor (V2R) mRNA. I and J: real-time PCR assay showing representative expression of NKCC2 (I) vs. NKCC1 mRNA (J) in rabbit kidney (1), rbTAL cells (2), and rat kidney extracts (3) from 4 independent experiments. Data are normalized for GAPDH mRNA, which was run in the same well, and are expressed as the change in cycle threshold (dCt).
Fig. 2.
Fig. 2.
A pool of membrane NKCC2 and related proteins from rat kidney is associated with LR-specific lipids. Purified membrane preparations from rat kidney extracts were solubilized with cold 1% Triton X-100 and assayed in sucrose gradient floating assays. Fractions show distribution of GM1 by dot blot (A), cholesterol, phosphatidylcholine, and sphingomyelin by TLC (B), and NKCC2 (C), co-localized THP (D), V2R (E), and Na+-Cl cotransporter (NCC) (F) by Western blots in the low-density LR raft fractions. The reference protein flotillin distributes in rafts (G), whereas clathrin is typically absent from LR (H). Densitometric scanning analysis of blots and TLC bands from at least 4 independent experiments is shown above the respective representative samples for the gradients. Products are enriched in the LR fractions ranging near 20% sucrose. The bands for NKCC2 were located at 160 kDa, THP at 98 kDa, V2R at 50 kDa, NCC at 165 kDa, flotillin at 48 kDa, and clathrin at 180 kDa.
Fig. 3.
Fig. 3.
Ultrastructural immunogold labeling of LR isolated from rat kidney outer medulla shows NKCC2-positive membranes. LR were prepared from purified membrane preparations after solubilization with cold 1% Triton X-100 and sucrose density gradient centrifugation technique. The detergent generates vesicle-like and fragmentary LR ∼200 nm in diameter. Rafts were incubated with antibodies against clathrin (A), NKCC2 (T4 antibody; B), THP (C), and GM1 (D). A subset of LR shows positive NKCC2 immunostaining. Bar, 200 nm.
Fig. 4.
Fig. 4.
Cholesterol depletion (CD) influences polar delivery of NKCC2 in TAL and blunts ion transport function of NKCC2 in Xenopus laevis oocytes. A–C: CD reduces the pool of NKCC2 in LR of rbTAL cells. Cells underwent CD by combined mevalonate-lovastatin and methyl-β-cyclodextrin (MβCD) treatment to inhibit cholesterol synthesis and disrupt LR. Rafts were prepared from purified membrane preparations after solubilization with cold 1% Triton X-100. Floating assays demonstrated cholesterol dependence in the partitioning of NKCC2 (A) and flotillin (B), but not clathrin (C), in LR. Densitometric scanning analysis of Western blots from 5 independent experiments is shown above the respective, representative Western blots. CD caused significant rightward shifts of NKCC2 in the LR fractions ranging near 20% sucrose. *P < 0.05 compared with vehicle. D and E: NKCC2 activity in X. laevis oocytes is reduced by CD. Oocytes were injected with water or NKCC2 cRNA, and 86Rb+ uptake was assessed. D: NKCC2-dependent 86Rb+ uptake in the absence (vehicle) or presence of 10 mM MβCD during 90 or 180 min, as indicated. E: normalized NKCC2-dependent 86Rb+ uptake (after subtraction of uptake in water-injected oocytes) in the absence of MβCD set as 100%. *P < 0.05 compared with vehicle. Data in both D and E are pooled results from 2 independent experiments with 10 oocytes per group each.
Fig. 5.
Fig. 5.
NKCC2 surface expression of rat medullary TAL and cultured rbTAL cells increases upon treatment with vasopressin (AVP). V2R mRNA (A) and immunoreactive NKCC2 (B) distributed in untreated control Long Evans (LE) rat medullary TAL. Intraperitoneal bolus injections of vehicle (0.9% NaCl; C) or 1-deamino-8-d-arginine vasopressin (dDAVP; 1 μg/kg; D) in Brattleboro rats with diabetes insipidus (DI rats) after 1 h; adluminal immunoreactive NKCC2 signal is enhanced upon treatment with dDAVP. A, in situ hybridization; B–D, immunoperoxidase staining with anti-NKCC2. Comparable effects are shown in vehicle (E) and AVP (1 × 10⁻⁷ M; 1 h)-treated rbTAL cells (F). Confocal merge signals of NKCC2 (red) and phalloidin identifying intracellular F-actin (green) are shown in the Z-axis with the apical side oriented toward the asterisk. Significant augmentation of red fluorescent NKCC2 label along with a shift toward the apical cell pole (asterisk) are shown.
Fig. 6.
Fig. 6.
AVP administration increases the pool of NKCC2 in LR from rat kidney outer medulla. An intraperitoneal bolus injection of vehicle (0.9% NaCl) compared with dDAVP (1 μg/kg) in DI rats after 1 h increased the proportion of NKCC2 (A) but not flotillin (B) partitioned in LR. Rafts were prepared from purified outer medullary membrane preparations after solubilization with cold 1% Triton X-100 and sucrose gradient floatation technique. Densitometric analysis of Western blots from 4 independent experiments with fractions F3–F6 were evaluated cumulatively. Representative Western blots are shown at bottom with the evaluated fractions boxed (discontinuous gradients). *P < 0.05 compared with vehicle.
Fig. 7.
Fig. 7.
Time-dependent effects of AVP stimulation on NKCC2 trafficking and protein abundance in rbTAL cells. A: time-dependent effects of AVP on NKCC2 surface expression are shown by semiquantitative evaluation of apical NKCC2 fluorescent signal. Values represent mean fluorescence intensity from 3 pooled apical confocal stacks. Baseline apical fluorescence was set at 100%. Representative confocal images are shown at bottom. B: time-dependent effects of AVP on NKCC2 protein abundance are shown by semiquantitative evaluation of Western blots from whole cell lysates and densitometric scanning. Results are normalized for the housekeeping protein β-actin. Representative blots are shown at bottom. C: as in B, time-dependent effects of AVP (1 and 4 h) on NKCC2 abundance are shown in the absence vs. presence of cycloheximide (cyclo). D: specificity of the AVP-induced changes in NKCC2 surface expression was demonstrated by application of the cAMP analog 8-bromo-cAMP (8-Br-cAMP), AVP alone, the PKA inhibitors H-89 and Rp-cAMPS, and cytochalasin B (CyB), each combined with AVP. Values were obtained from confocal microscopy of apical NKCC2 immunofluorescent signal. Values represent mean fluorescence intensity from pooled apical confocal stacks. Results are from 3 (A), 4 (B), 5 (C), and 3 independent experiments (D), respectively. *P < 0.05 compared with vehicle. **P < 0.05 compared with AVP.
Fig. 8.
Fig. 8.
Short-term AVP administration increases copatching of NKCC2 with the LR component, ganglioside GM1, in rbTAL cells. Confocal analysis shows the effects of short-term vehicle vs. AVP administration (1 × 10⁻⁷ M; 1 h) on the degree of coincident fluorescence of immunostained NKCC2 and the choleratoxin-B (CT-B)-labeled ganglioside GM1. Diagrams at bottom indicate the degree of merged signals between CT-B plotted on the X-axis and NKCC2 on the Y-axis, indicating copatching.
Fig. 9.
Fig. 9.
AVP-induced changes of NKCC2 in rbTAL cells are cholesterol-dependent. A: confocal analysis shows the effects of AVP (1 × 10⁻⁷ M; 1 h) with and without CD by combined mevalonate-lovastatin (M/L)/MβCD treatment on NKCC2 surface expression. Values indicate quantification of the apical fluorescence intensity from 3 pooled apical confocal stacks with the vehicle control set at 100%. Representative confocal images are shown at bottom. B: representative Western blots from rbTAL cell extracts show specific bands for NKCC2 and densitometric evaluation with intensity values normalized for β-actin. C: ELISA measurements of cAMP accumulation in rbTAL cells incubated for 1 h with vehicle or AVP, combined with CD induced by M/L, MβCD, or a combination of M/L and MβCD. Results are from 3 (A), 4 (B), and 4 independent experiments (C), respectively. *P < 0.05 compared with vehicle.
Fig. 10.
Fig. 10.
Biotinylation assays show the amount of surface-expressed NKCC2 is increased upon AVP stimulation of rbTAL cells in a cholesterol-dependent manner. Plasma membrane fractions (A and B) and intracellular fractions (C and D) from rbTAL cells pretreated with vehicle (PBS; A and C) or M/L/MβCD for CD (B and D) were analyzed for their responses to short-term AVP treatment (1 h). The cell monolayers were surface-biotinylated and lysed, and membrane as well as intracellular fractions were immunoprecipitated with anti-NKCC2 antibody. SDS-PAGE and Western blots were performed with the eluates. In A–D, columns at left show the biotinylated fraction of NKCC2 as detected by streptavidin-horseradish peroxidase (HRP), whereas columns at right show the level of immunoreactive NKCC2 as detected by anti-NKCC2 antibody. Densitometric analysis of the blots from 3 independent experiments were evaluated; the controls are the vehicle bars in A of the respective streptavidin-HRP-detected or the anti-NKCC2-detected values, which are set at 100%, respectively. Representative blot images are shown at bottom; all documented blot samples were run in parallel in the selected experiment. In each lane, a concentration of 20 μg of protein was run on the gel. *P < 0.05 compared with the respective vehicle in A.

Similar articles

Cited by

References

    1. Amlal H, Legoff C, Vernimmen C, Paillard M, Bichara M. Na+-K+(NH4+)-2Cl− cotransport in medullary thick ascending limb: control by PKA, PKC, and 20-HETE. Am J Physiol Cell Physiol 271: C455–C463, 1996. - PubMed
    1. Bock J, Gulbins E. The transmembranous domain of CD40 determines CD40 partitioning into lipid rafts. FEBS Lett 534: 169–174, 2003. - PubMed
    1. Breton S, Lisanti MP, Tyszkowski R, McLaughlin M, Brown D. Basolateral distribution of caveolin-1 in the kidney. Absence from H+-ATPase-coated endocytic vesicles in intercalated cells. J Histochem Cytochem 46: 205–214, 1998. - PubMed
    1. Brown DA Lipid rafts, detergent-resistant membranes, and raft targeting signals. Physiology 21: 430–439, 2006. - PubMed
    1. Cavallone D, Malagolini N, Serafini-Cessi F. Mechanism of release of urinary Tamm-Horsfall glycoprotein from the kidney GPI-anchored counterpart. Biochem Biophys Res Commun 280: 110–114, 2001. - PubMed

Publication types

MeSH terms