. 2008 Jun 25;28(26):6731-41.
doi: 10.1523/JNEUROSCI.1227-08.2008.

Theta and gamma coordination of hippocampal networks during waking and rapid eye movement sleep

Affiliations

Theta and gamma coordination of hippocampal networks during waking and rapid eye movement sleep

Sean M Montgomery et al. J Neurosci. .

Abstract

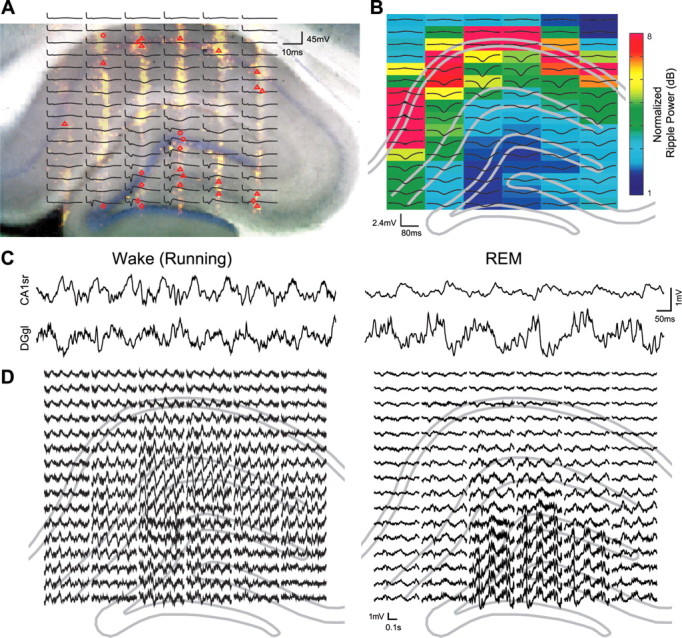
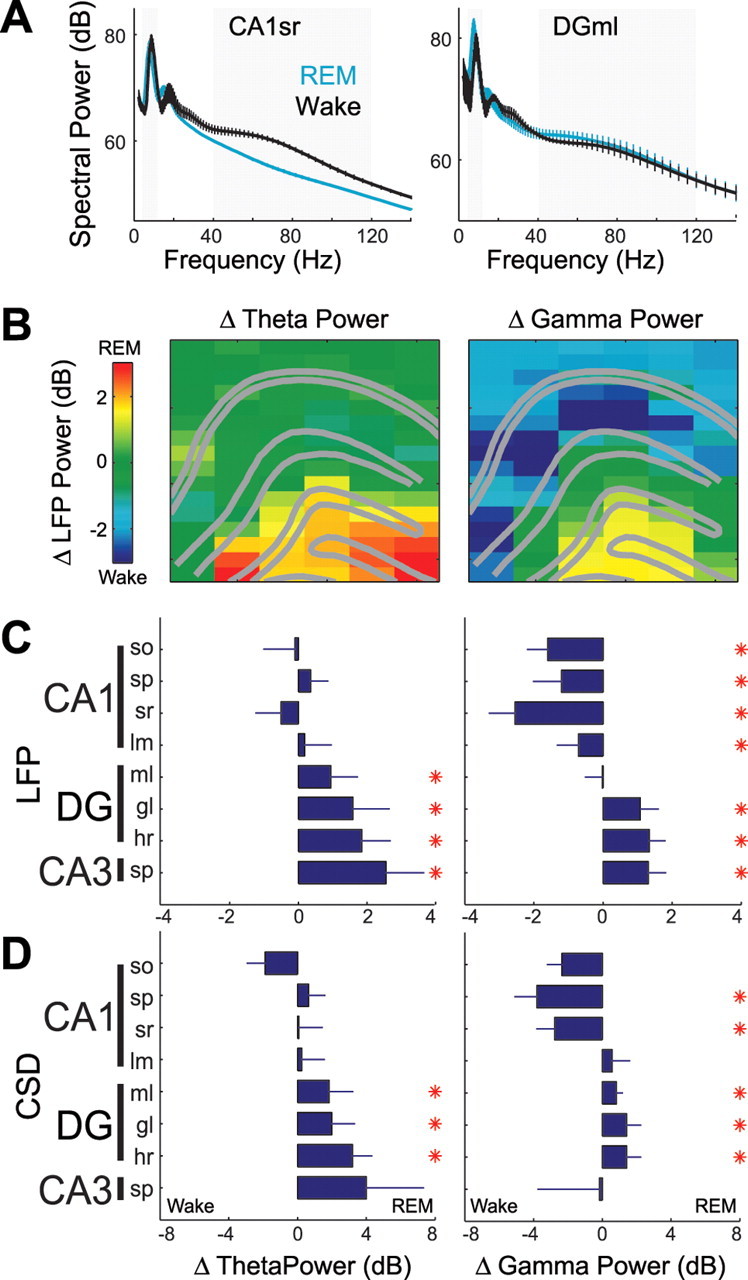
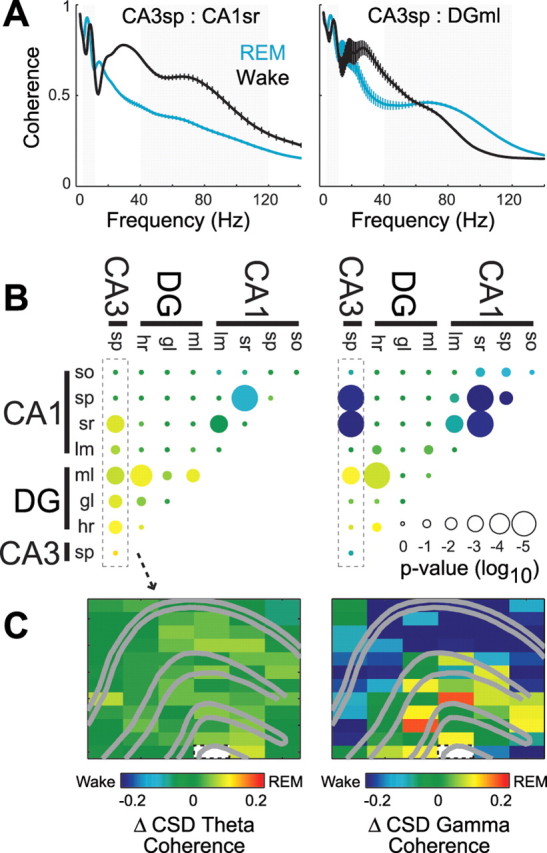
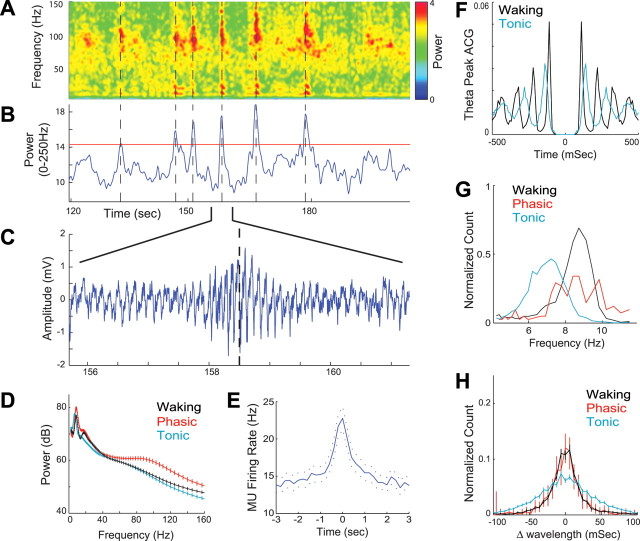
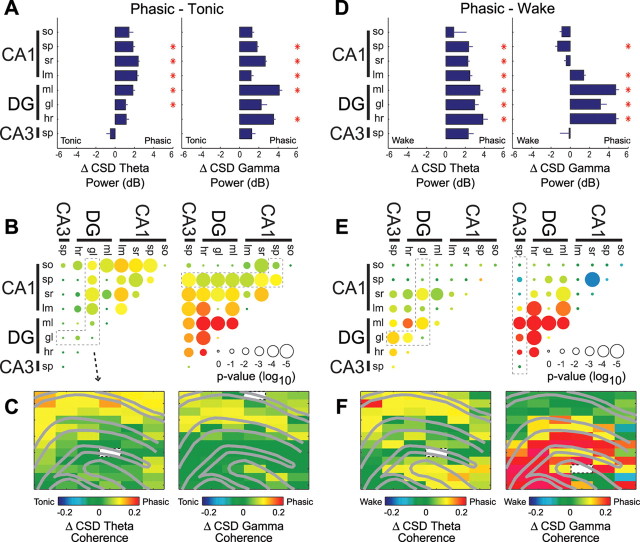
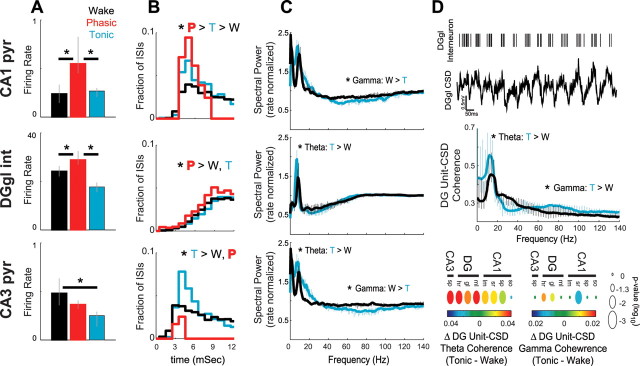
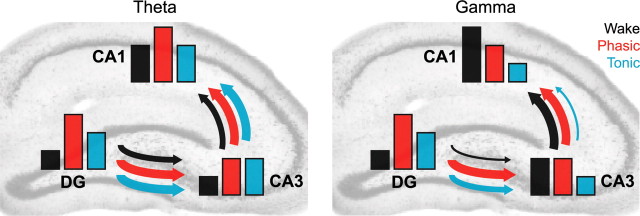
Rapid eye movement (REM) sleep has been considered a paradoxical state because, despite the high behavioral threshold to arousing perturbations, gross physiological patterns in the forebrain resemble those of waking states. To understand how intrahippocampal networks interact during REM sleep, we used 96 site silicon probes to record from different hippocampal subregions and compared the patterns of activity during waking exploration and REM sleep. Dentate/CA3 theta and gamma synchrony was significantly higher during REM sleep compared with active waking. In contrast, gamma power in CA1 and CA3-CA1 gamma coherence showed significant decreases in REM sleep. Changes in unit firing rhythmicity and unit-field coherence specified the local generation of these patterns. Although these patterns of hippocampal network coordination characterized the more common tonic periods of REM sleep (approximately 95% of total REM), we also detected large phasic bursts of local field potential power in the dentate molecular layer that were accompanied by transient increases in the firing of dentate and CA1 neurons. In contrast to tonic REM periods, phasic REM epochs were characterized by higher theta and gamma synchrony among the dentate, CA3, and CA1 regions. These data suggest enhanced dentate processing, but limited CA3-CA1 coordination during tonic REM sleep. In contrast, phasic bursts of activity during REM sleep may provide windows of opportunity to synchronize the hippocampal trisynaptic loop and increase output to cortical targets. We hypothesize that tonic REM sleep may support off-line mnemonic processing, whereas phasic bursts of activity during REM may promote memory consolidation.


Figures

Figure 1.
Figure 1.
Identification of recording site locations and laminar-specific changes in hippocampal network synchrony during REM sleep versus active waking behavior. A, B, Anatomical positions of recording sites were localized for each recording session by aligning the histology with several spontaneous and evoked activity patterns (see Materials and Methods). A, Histological sections with DiI labeling of electrode tracks (yellow) overlaid with estimated locations of single units (red points; location estimated from waveform amplitudes; putative cell types: triangle, principal cell; circle, interneuron; diamond, unclassified) and average perforant path evoked potentials (black traces; n = 3). Note the EPSP-associated negativity in the dentate molecular layer and monosynaptic and disynaptic population spikes in the dentate and CA3, respectively, resulting from perforant path stimulation. B, Ripple-triggered average LFP responses (black traces; centered on ripple event; n = 179) overlaid on normalized ripple power (color; 120–250 Hz) and outline of histological features (gray lines). C, D, Example of raw local field potential traces recorded during REM sleep and running in a maze. C, One second LFP traces from CA1 stratum radiatum (CA1sr) and the dentate granule layer (DGgl). D, LFP activity (0.5 s overlapping with trace in C) centered on the anatomical location from which the trace was recorded. Note the higher theta and gamma oscillation amplitudes on dentate recording sites during REM sleep but the larger gamma in CA1sr during wake. Signals were spatially interpolated over a priori identified defunct recording sites (see Materials and Methods).
Figure 2.
Figure 2.
Region-specific changes in hippocampal theta and gamma power during REM sleep versus active waking behavior. A, Example power spectra from one animal (decibels; ±SEM across recording sites) of local currents recorded from CA1 stratum radiatum (CA1sr) (n = 6 sites) and dentate molecular layer (DGml) (n = 4 sites) sites during a single recording session including REM and waking. Theta (4–12 Hz) and gamma (40–120 Hz) frequency ranges are highlighted in gray. B–D, Changes in the power (amplitude) of theta (left column) and gamma (right column) oscillations across REM and waking states (REM − wake). Positive values indicate increases during REM sleep compared with active waking behavior. B, Anatomical profile showing state-dependent changes in LFP power for each recording site from one recording session. C, D, Group statistics showing changes in LFP (C) and current source density (CSD) (D) power across different layers of hippocampal subregions (decibels; ±SEM; *p < 0.01, Bonferroni-corrected t tests). Calculating dB = 10 × log10(voltage2), a 1–4 dB change is equivalent to a 12–58% change in the voltage amplitude of the raw LFP oscillation. Abbreviations: CA, Cornu ammonis; so, stratum oriens; sp, stratum pyramidale; sr, stratum radiatum; lm, stratum lacunosum moleculare; ml, molecular layer; gl, granule layer; hr, hilar region.
Figure 3.
Figure 3.
Behavior-dependent changes in theta and gamma coherence across hippocampal regions. A, Example coherence spectra from one animal (±SEM across recording site pairs) between CA3sp and CA1sr (top; n = 6 pairs) and between CA3sp and DGml (bottom; n = 4 pairs) during REM and waking. Note the peak in gamma coherence ∼80 Hz that varies differentially between site pairs across behavioral states. Coherence peaks in the 15–30 Hz range during waking likely reflect increased theta harmonics during running behavior (Figs. 1, 2) (Buzsaki et al., 1986; Terrazas et al., 2005). B, C, Changes in CSD theta (left column) and gamma (right column) coherence across REM and waking states (REM − wake). B, Group statistics showing REM sleep-associated change in theta and gamma coherence between all hippocampal layer pairs. The color of each dot shows the average within-pair change in coherence, and size of the dot indicates the significance of Bonferroni-corrected t tests. The outlined column of dots corresponds to the profile of changes in coherence with respect to the CA3 pyramidal layer (CA3sp). C, Example anatomical profile of the changes in coherence with respect to the CA3 pyramidal layer (outlined white pixel) from one recording session. Other abbreviations are as defined in the legend to Figure 2.
Figure 4.
Figure 4.
Identification of phasic activity bursts in the dentate gyrus. A, Whitened spectrogram of an LFP recorded from the dentate molecular layer showing a typical period from REM sleep. Note the transient increases in the power and peak frequency of both theta and gamma oscillations. The gamma power increase in the whitened spectrum typically peaked at ∼100 Hz, but the elevated power in these bursts often extended up to ∼250 Hz. B, Phasic bursts of activity in REM sleep were detected using a threshold of 2 SDs from the average molecular layer integrated whitened power (0–250 Hz). C, Typical example of the dentate molecular layer LFP during a detected burst of activity. D, LFP power spectra in the dentate molecular layer compared across different behavioral states (decibels; mean ± SEM across 18 DGml recording sites). E, Granule layer multiple-unit firing rates increased during detected phasic bursts (n = 13; ±SEM). F–H, Lower theta frequency and greater wave-by-wave variability during low-power “tonic” periods than during detected phasic periods or active waking behavior. F, Example autocorrelogram of theta peaks. G, Group data histogram of peak theta frequencies calculated from 1 s spectral estimates. H, Wave-by-wave change in theta wavelength (second temporal derivative of theta peak times) with bootstrapped 95% confidence bars.
Figure 5.
Figure 5.
Changes in hippocampal network coordination during phasic REM versus tonic REM and active waking. A–F, Changes in theta and gamma synchrony (left and right panels of each subplot, respectively) between phasic and tonic REM sleep (A–C) (phasic − tonic) and between phasic REM and active waking (D–F) (phasic − waking). A, B, D, E, Group statistics show changes in CSD power (A, D) (decibels; ±SEM; Bonferroni-corrected t tests) and coherence (B, E) (dot color, mean within-site change; dot size, significance of Bonferroni-corrected t tests; *p < 0.01). C, F, Examples from one recording session showing anatomical maps of coherence changes with respect to a single reference site (white pixel) illustrating the highlighted group of layer pairs (dotted outline) in B and E. Abbreviations are as defined in the legend to Figure 2.
Figure 6.
Figure 6.
Behavior-dependent changes in hippocampal unit firing. A–C, Changes in firing properties of CA1 pyramidal cells (pyr) (top row), dentate granule layer interneurons (int) (middle row), and CA3 pyramidal cells (bottom row) during active waking (black), phasic (red), and tonic (cyan) REM sleep. Changes in firing rate (CA1, n = 28; DG, n = 10; CA3, n = 27) (A), bursting [fraction of interspike intervals (ISIs) <6 ms (Harris et al., 2001); CA1, n = 18; DG, n = 10; CA3, n = 18] (B), and unit-firing theta (4–12 Hz) and gamma (40–120 Hz) rhythmicity [rate normalized spectral analysis (Jarvis and Mitra, 2001); CA1, n = 15; DG, n = 10; CA3, n = 13] (C). D, Changes in unit-CSD coherence across active waking and tonic REM sleep. Top row, One second example of a putative interneuron and simultaneously recorded CSD from the dentate granule layer. Note the high degree of unit firing theta rhythmicity and phase locking to local currents. Middle row, Average coherence spectrum of all granule layer interneurons with dentate hilar region CSD traces. Bottom row, Group statistics showing theta and gamma coherence changes between granule layer interneuron firing and CSD traces recorded from all hippocampal layers (CA1, n = 15; DG, n = 10; CA3, n = 13). Because of small sampling and potential contamination from nonstationarity effects, phasic REM was excluded from unit spectral analyses. CA1 and CA3 pyramidal cells were further excluded from coherence analyses because of insufficient firing rates. See Materials and Methods for firing rate inclusion criteria of bursting and spectral analyses. All results were statistically tested using Bonferroni-corrected within-cell nonparametric Kruskal–Wallis and post hoc tests; *p < 0.05. Other abbreviations are as defined in the legend to Figure 2.
Figure 7.
Figure 7.
Summary of hippocampal network coordination during active waking and tonic and phasic REM sleep. Bar height reflects within-region synchrony changes, combining the effects of CSD power, within-region CSD coherence, unit rhythmicity, and within-region unit-CSD coherence. The arrow thickness reflects between-region coordination changes, combining CSD coherence and unit-CSD coherence between different hippocampal regions. Note the increase in dentate synchrony and dentate–CA3 coordination at theta and gamma frequencies during tonic REM sleep compared with active waking. In contrast, gamma synchrony in CA1 and CA3–CA1 gamma coordination was significantly lower during tonic REM sleep than active waking. Phasic REM, however, is accompanied by high theta and gamma synchronization throughout the trisynaptic circuit.

Similar articles

Cited by

References

    1. Amaral DG, Witter MP. Hippocampal formation. In: Paxinos G, editor. The rat nervous system. New York: Academic; 1995. pp. 443–490.
    1. Aserinsky E, Kleitman N. Regularly occurring periods of eye motility, and concomitant phenomena, during sleep. Science. 1953;118:273–274. - PubMed
    1. Aston-Jones G, Bloom FE. Activity of norepinephrine-containing locus coeruleus neurons in behaving rats anticipates fluctuations in the sleep-waking cycle. J Neurosci. 1981;1:876–886. - PMC - PubMed
    1. Bartho P, Hirase H, Monconduit L, Zugaro M, Harris KD, Buzsaki G. Characterization of neocortical principal cells and interneurons by network interactions and extracellular features. J Neurophysiol. 2004;92:600–608. - PubMed
    1. Bastuji H, Garcia-Larrea L. Evoked potentials as a tool for the investigation of human sleep. Sleep Med Rev. 1999;3:23–45. - PubMed

Publication types

MeSH terms

LinkOut - more resources