Comparative Study
. 2008 Sep;295(3):C708-21.
doi: 10.1152/ajpcell.00029.2008. Epub 2008 Jun 25.

Copper is taken up efficiently from albumin and alpha2-macroglobulin by cultured human cells by more than one mechanism

Affiliations
Comparative Study

Copper is taken up efficiently from albumin and alpha2-macroglobulin by cultured human cells by more than one mechanism

Mizue Moriya et al. Am J Physiol Cell Physiol. 2008 Sep.

Abstract

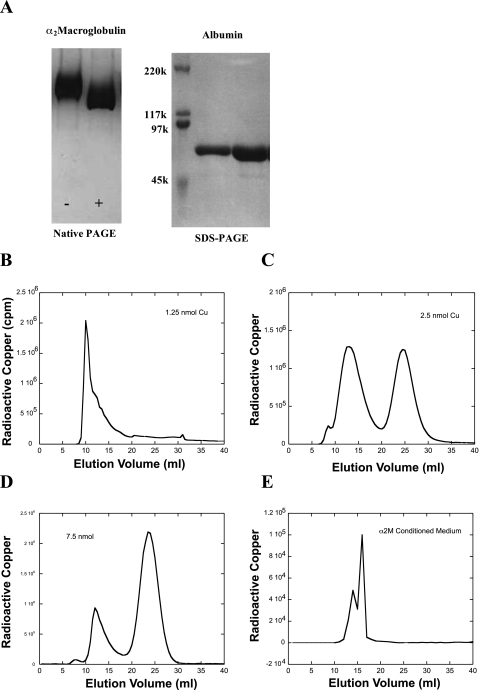
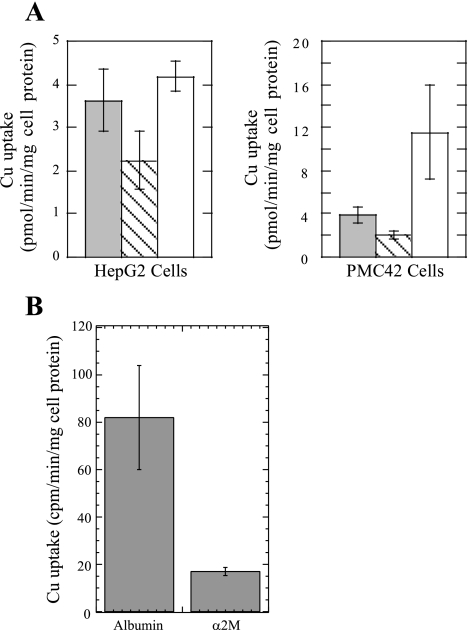
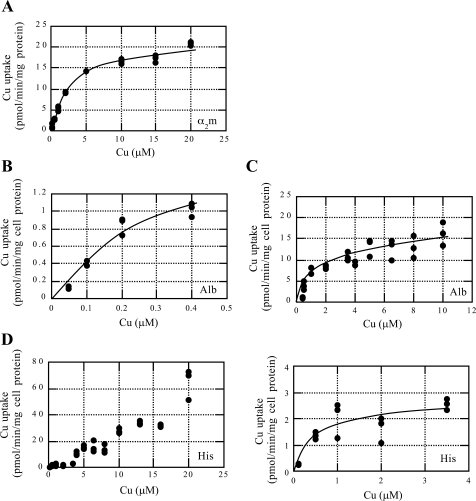
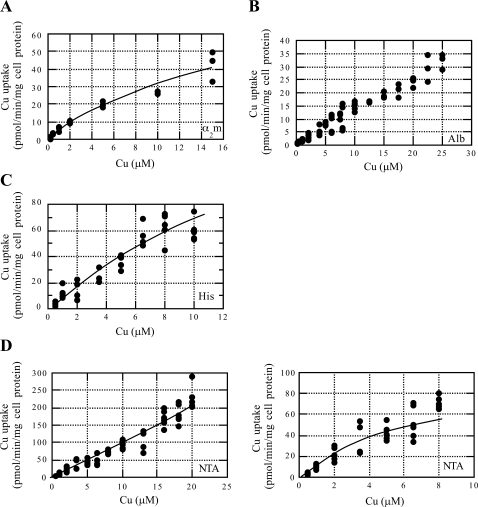
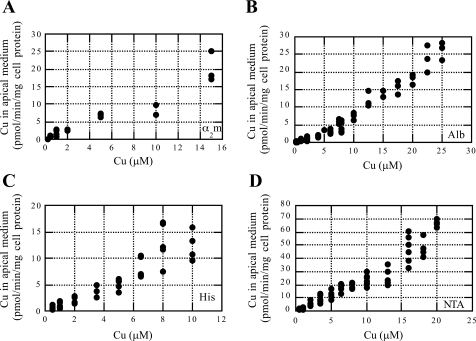
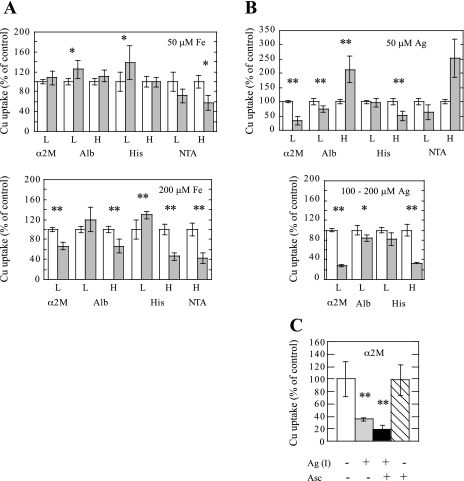
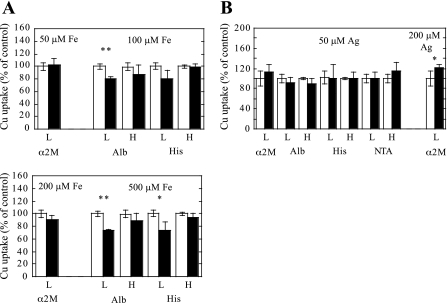
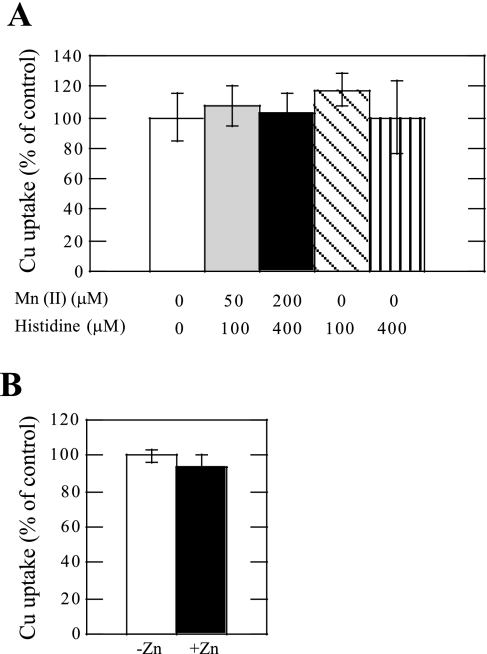
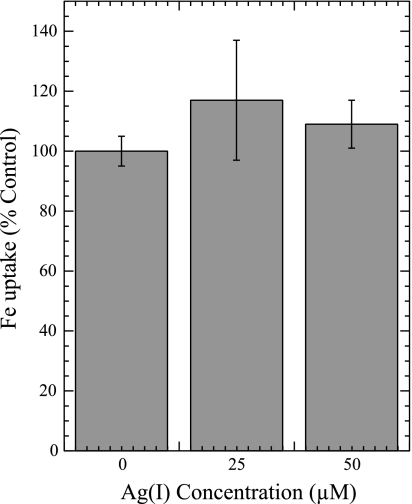
Ionic copper entering blood plasma binds tightly to albumin and the macroglobulin transcuprein. It then goes primarily to the liver and kidney except in lactation, where a large portion goes directly to the mammary gland. Little is known about how this copper is taken up from these plasma proteins. To examine this, the kinetics of uptake from purified human albumin and alpha(2)-macroglobulin, and the effects of inhibitors, were measured using human hepatic (HepG2) and mammary epithelial (PMC42) cell lines. At physiological concentrations (3-6 muM), both cell types took up copper from these proteins independently and at rates similar to each other and to those for Cu-dihistidine or Cu-nitrilotriacetate (NTA). Uptakes from alpha(2)-macroglobulin indicated a single saturable system in each cell type, but with different kinetics, and 65-80% inhibition by Ag(I) in HepG2 cells but not PMC42 cells. Uptake kinetics for Cu-albumin were more complex and also differed with cell type (as was the case for Cu-histidine and NTA), and there was little or no inhibition by Ag(I). High Fe(II) concentrations (100-500 microM) inhibited copper uptake from albumin by 20-30% in both cell types and that from alpha(2)-macroglobulin by 0-30%, and there was no inhibition of the latter by Mn(II) or Zn(II). We conclude that the proteins mainly responsible for the plasma-exchangeable copper pool deliver the metal to mammalian cells efficiently and by several different mechanisms. alpha(2)-Macroglobulin delivers it primarily to copper transporter 1 in hepatic cells but not mammary epithelial cells, and additional as-yet-unidentified copper transporters or systems for uptake from these proteins remain to be identified.


Figures

Fig. 1.
Fig. 1.
Purity and copper loading of α2-macroglobulin (α2M) in the presence of albumin (Alb) and its retention in conditioned medium. A: native PAGE of purified α2M (left) and SDS-PAGE of purified Alb (right). In the case of α2M, samples shown were (+) and were not (−) pretreated with methylamine to convert the open form to the closed form of the protein. SDS-PAGE gave subunits of 180 kDa (data not shown). B–D: Sephadex G150 chromatographic separation of 64Cu-labeled α2M, Alb, and Cu-nitrilotriacetate (NTA) after a preincubation with 5 nmol of the pure α2M subunit, 5 nmol of pure Alb, and 1.25 (B), 2.5 (C), and 7.5 (D) nmol of 64Cu-labeled Cu(II) (as the NTA complex) in 0.50 ml (see materials and methods). Nanomoles of copper bound to α2M were calculated from the proportion of radioactivity associated with that protein peak. For A, B, and C, the proportions were 63%, 54%, and 26%, respectively. E: elution of radioactive copper on α2M after use in uptake experiments with cultured (PMC42) cells. Conditioned medium, from cultures incubated with 2 μM 64Cu-labeled copper bound to pure human α2M, was separated by Sephadex G150 chromatography, as in B–D, except that a slightly larger (1 × 28 cm) column was used. Radioactivity was still bound to α2M (also verified by immunoblot analysis of 64Cu peak fractions).
Fig. 2.
Fig. 2.
Copper is taken up efficiently by HepG2 and PMC42 cells from human α2M or Alb and from the Cu-di-histidine (His) complex. A: data show the initial rates of uptake (in pmol·min−1·mg cell protein−1) from pure α2M (shaded bar), Alb (hatched bar), and Cu-di-His (open bar) by HepG2 cells (left) and PMC42 cell monolayers (right) after the administration of copper (1 μM) bound to these proteins. Values are means ± SD; n = 12. All differences, except between uptake from α2M and His in PMC42 cells, were statistically significant (P < 0.001). B: initial rates of uptake of 64Cu by HepG2 cells from Alb and α2M fractions of whole human plasma. In this experiment, tracer 64Cu-NTA was added to whole plasma, and α2M and Alb fractions were separated on Sephadex G150 before the incubation of equal volumes of the peak fractions with cells for 30 min. Cell radioactivity [in counts·min−1·mg cell protein−1 (cpm/mg cell protein)] values are means ± SD; n = 4. Radioactivity could not be translated into nanomoles copper; thus, actual copper concentrations and 64Cu specific activity were not determined.
Fig. 3.
Fig. 3.
Kinetics of copper uptake by HepG2 cells from α2M, Alb, and His. A: initial rates of copper uptake (in pmol·min−1·mg cell protein−1) from α2M at different Cu-α2M concentrations, from 0.1 to 20 μM Cu. Kinetic analysis indicated a Vmax value of 22 pmol·min−1·mg−1 and a Km value of 3 μM. B: initial rates of copper uptake from Alb at concentrations from 0.1 to 0.4 μM. Kinetic analysis indicated a Vmax value of 2.0 pmol·min−1·mg−1 and a Km value of 0.36 μM. C: Cu-Alb uptake data for 0.4–10 μM gave a Vmax value of 18 pmol·min−1·mg−1 and a Km value of 2.4 μM. D: initial rates of copper uptake from Cu(II)-di-His at concentrations from 0.1 to 20 μM (left) and from 0 to 3.5 μM (right). The latter gave a Vmax value of 2.9 pmol·min−1·mg−1 and a Km value of 0.6 μM. Data for higher concentrations did not yield standard kinetic values.
Fig. 4.
Fig. 4.
Kinetics of copper uptake by PMC42 cells from α2M, Alb, His, and NTA. A: initial rates of copper uptake (in pmol·min−1·mg cell protein−1) from α2M at concentrations from 0.1 to 15 μM Cu. Kinetic analysis indicated a Vmax value of 100 pmol·min−1·mg−1 and a Km value of 22 μM. B: initial rates of copper uptake from Alb at concentrations from 0.1 to 25 μM gave values for Vmax and Km values of 194 pmol·min−1·mg−1 and 131 μM, respectively. C: initial rates of copper uptake from Cu(II)-di-His concentrations of 0.1–10 μM gave Vmax and Km values of 206 pmol·min−1·mg−1 and 21 μM, respectively. D: initial rates of copper uptake from Cu(II)-NTA concentrations of 0.1–20 μM (left) and 0–8 μM (right). Only the latter gave kinetic values for Vmax (140 pmol·min−1·mg−1) and Km (11 μM).
Fig. 5.
Fig. 5.
Transfer of copper from mammary epithelial cells (PMC42 cells) to the apical medium after delivery of 64Cu-labeled copper on α2M (A), Alb (B), His (C), or NTA (D) to the basolateral surface of the monolayer. Data are 64Cu absorbed from the basal chamber that was released to the apical medium after the administration of various concentrations of Cu attached to the proteins or chelators, using the specific radioactivity of the original 64Cu for calculations of release rates (in pmol·min−1·mg cell protein−1).
Fig. 6.
Fig. 6.
Effects of iron and silver ions on copper uptake from plasma proteins and chelators by HepG2 cells. Uptake (30 min) of copper attached to α2M, Alb, His, or NTA at lower (L) or higher (H) concentrations was measured in the absence (open bars) and presence (shaded bars) of 50 or 200 μM Fe(II)-NTA (1:5) (A) or 50 or 100–200 μM Ag(I) (B). Uptake from α2M was only measured at the lower concentration of 2 μM Cu (1 μM protein). Low and high copper concentrations otherwise were 1 and 8 μM for Cu-Alb and 1 and 10 μM for Cu-di-His and Cu-NTA. C: uptake of copper (2 μM) from α2M (1 μM) in the absence (open and hatched bars) and presence (shaded and solid bars) of 50 μM Ag(I) measured with (solid and hatched bars) or without (white and shaded bars) 1 mM ascorbate (Asc) added to the medium. Values, presented as percentages of control (no competing ions) (open bars) within a given experiment (combining data from several experiments), are given as means ± SD. For A and B, n = 6–12 for Cu-α2M, 5–15 for Cu-Alb, 9–27 for Cu-di-His, and 6–14 for Cu-NTA. For C, n = 6. *P > 0.01 and **P < 0.001, statistically significant differences from controls. Actual (control) copper uptake rates (in pmol·min−1·mg cell protein−1) for A–C were 3.4–5.7 for α2M, 2.2–3.3 and 11–15 for 1 and 8 μM Cu-Alb, 3.7–4.2 and 38–54 for 1 and 10 μM Cu-di-His, and 7.0–7.5 and 16–35 for 1 and 10 μM Cu-NTA, respectively.
Fig. 7.
Fig. 7.
Effects of iron and silver ions on copper uptake from plasma proteins and chelators by PMC42 cell monolayers. Uptake (30 min) of copper attached to α2M, Alb, His, or NTA at lower or higher concentrations was measured in the absence (open bars) and presence (solid bars) of 50–500 μM Fe(II)-NTA (1:5), as indicated (A), or 50 or 200 μM Ag(I) (B). Uptake from α2M was only measured at the lower concentration of 2 μM Cu, 1 μM protein. Otherwise, low and high copper concentrations were 1 and 8 μM for Cu-Alb and 1 and 10 μM for Cu-di-His and Cu-NTA. Values, presented as percentages of control (no competing ions) (open bars) within a given experiment (combining data from several experiments), are given as means ± SD; n = 6–12 for Cu-α2M, 4–9 for Cu-Alb, 4–12 for Cu-di-His, and 6–12 for Cu-NTA. *P < 0.01 and **P < 0.001, statistically significant differences from controls. Actual (control) copper uptake rates (in pmol·min−1·mg cell protein−1) for A and B were 3.6–4.3 for α2M, 1.9 and 10 for 1 and 8 μM Cu-Alb, 3.7 and 60 for 1 and 10 μM Cu-di-His, and 6.0–7.2 and 54 for 1 and 10 μM Cu-NTA, respectively.
Fig. 8.
Fig. 8.
No effects of manganese and zinc ions on the uptake of copper from α2M by HepG2 cells. A: effects of 50 and 200 μM Mn(II)-His (1:2) on the uptake of 2 μM Cu on 1 μM α2M. Values are percentages of control from several experiments (means ± SD). Open bar, controls (no competing ions, n = 12); shaded bar, 50 μM Mn(II) (n = 3); solid bar, 200 μM Mn(II) (n = 4); hatched bar, 100 μM His alone (n = 6); lined bar, 400 μM His alone (n = 4). Actual Cu uptake rates for controls averaged 5.5 ± 1.9 pmol·min−1·mg cell protein−1. B: effect of 200 μM Zn(II) (solid bar; n = 6) on the uptake of copper from 2 μM Cu on 1 μM α2M compared with control (open bar; n = 6). Actual Cu uptake rates for controls averaged 3.4 ± 0.1 pmol·min−1·mg cell protein−1.
Fig. 9.
Fig. 9.
No effects of Ag(I) on the uptake of Fe(II) by Caco2 cell monolayers. Monolayers with tight junctions grown on filters in 12-well Transwells were administered 1 μM 59Fe(II) (in 1 mM Asc) in the apical fluid, and uptake into cells and the basal medium was recorded over 30 min in the absence and presence of two concentrations of Ag(I), as indicated. Results are given as percentages of control (means ± SD; n = 4–8), combining data from 2 separate experiments.

Similar articles

Cited by

References

    1. Ackland ML, Michalczyk A, Whitehead RH. PMC42, a novel model for the differentiated breast. Exp Cell Res 263: 14–22, 2001. - PubMed
    1. Ackland ML, Newgreen DF, Price J, Fridman M, Waltham MC, Arvanitis A, Minichiello J, Price JT, Thompson A. Epidermal growth factor-induced epithelio-mesenchymal transition in human breast carcinoma cells. Lab Invest 83: 435–448, 2003. - PubMed
    1. Arredondo M, Munoz P, Mura CV, Nunez MT. DMT1, a physiologically relevant apical Cu1+ transporter of intestinal cells. Am J Physiol Cell Physiol 284: C1525–C1530, 2003. - PubMed
    1. Barrow L, Tanner MS. Copper distribution among serum proteins in paediatric liver disorders and malignancies. Eur J Clin Invest 18: 555–560, 1988. - PubMed
    1. Bertinato J, Swist E, Plouffe LJ, Brooks SP, L'Abbé MR. Ctr2 is partially localized to the plasma membrane and stimulates copper uptake in COS-7 cells. Biochem J 409: 731–740, 2007. - PubMed

Publication types

MeSH terms