

Computational analysis of miRNA-mediated repression of translation: implications for models of translation initiation inhibition
- PMID: 18579870
- PMCID: PMC2491470
- DOI: 10.1261/rna.1072808
Computational analysis of miRNA-mediated repression of translation: implications for models of translation initiation inhibition
Abstract
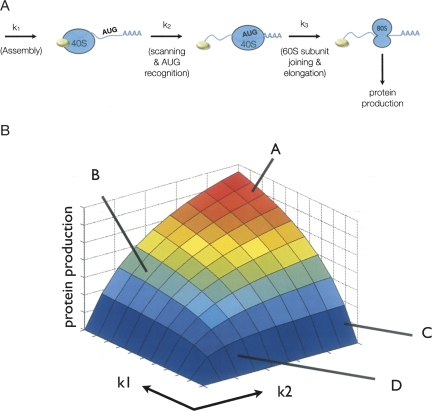
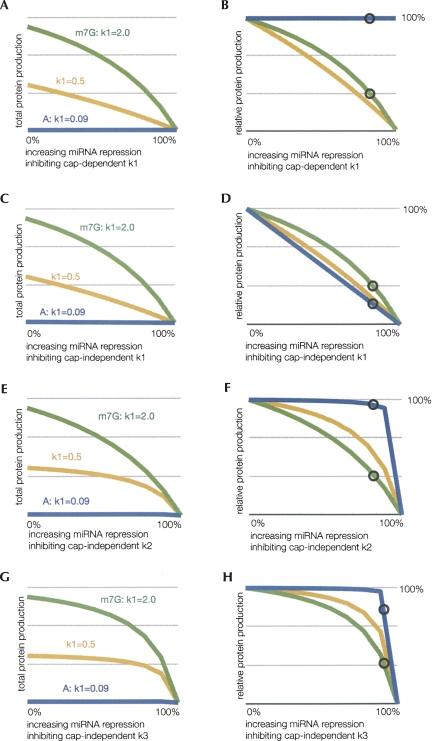
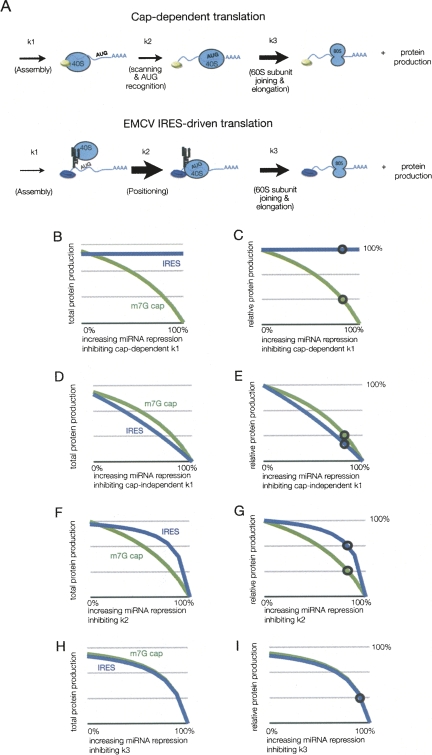
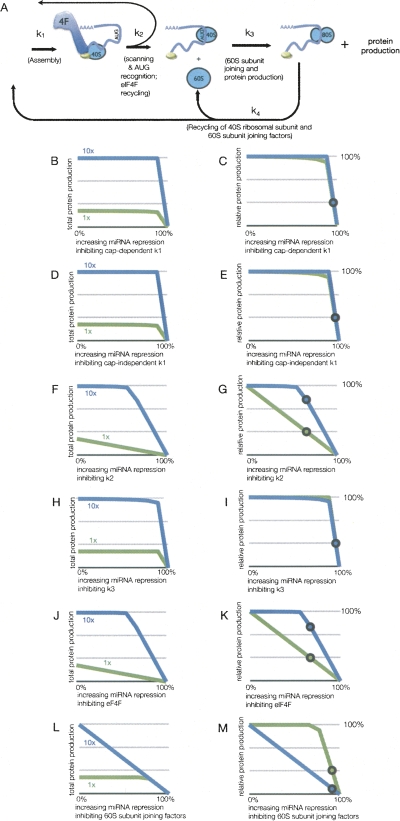
The mechanism by which miRNAs inhibit translation has been under scrutiny both in vivo and in vitro. Divergent results have led to the suggestion that miRNAs repress translation by a variety of mechanisms including blocking the function of the cap in stimulating translation. However, these analyses largely only examine the final output of the multistep process of translation. This raises the possibility that when different steps in translation are rate limiting, miRNAs might show different effects on protein production. To examine this possibility, we modeled the process of translation initiation and examined how the effects of miRNAs under different conditions might be explained. Our results suggest that different effects of miRNAs on protein production in separate experiments could be due to differences in rate-limiting steps. This analysis does not rule out that miRNAs directly repress the function of the cap structure, but it demonstrates that the observations used to argue for this effect are open to alternative interpretations. Taking all the data together, our analysis is consistent with the model that miRNAs may primarily repress translation initiation at a late step.
Figures
Similar articles
-
Drosophila miR2 primarily targets the m7GpppN cap structure for translational repression.Mol Cell. 2009 Sep 24;35(6):881-8. doi: 10.1016/j.molcel.2009.09.009. Mol Cell. 2009. PMID: 19782035
-
miRNAs get an early start on translational silencing.Cell. 2007 Oct 5;131(1):25-8. doi: 10.1016/j.cell.2007.09.021. Cell. 2007. PMID: 17923084 Review.
-
MicroRNAs control translation initiation by inhibiting eukaryotic initiation factor 4E/cap and poly(A) tail function.Proc Natl Acad Sci U S A. 2005 Nov 22;102(47):16961-6. doi: 10.1073/pnas.0506482102. Epub 2005 Nov 15. Proc Natl Acad Sci U S A. 2005. PMID: 16287976 Free PMC article.
-
Repression of C. elegans microRNA targets at the initiation level of translation requires GW182 proteins.EMBO J. 2009 Feb 4;28(3):213-22. doi: 10.1038/emboj.2008.275. Epub 2009 Jan 8. EMBO J. 2009. PMID: 19131968 Free PMC article.
-
How do microRNAs regulate gene expression?Biochem Soc Trans. 2008 Dec;36(Pt 6):1224-31. doi: 10.1042/BST0361224. Biochem Soc Trans. 2008. PMID: 19021530 Review.
Cited by
-
Kinetic signatures of microRNA modes of action.RNA. 2012 Sep;18(9):1635-55. doi: 10.1261/rna.032284.112. Epub 2012 Jul 31. RNA. 2012. PMID: 22850425 Free PMC article.
-
Systemic CLIP-seq analysis and game theory approach to model microRNA mode of binding.Nucleic Acids Res. 2021 Jun 21;49(11):e66. doi: 10.1093/nar/gkab198. Nucleic Acids Res. 2021. PMID: 33823551 Free PMC article.
-
Dynamical modeling of microRNA action on the protein translation process.BMC Syst Biol. 2010 Feb 24;4:13. doi: 10.1186/1752-0509-4-13. BMC Syst Biol. 2010. PMID: 20181238 Free PMC article.
-
Slowly produced microRNAs control protein levels.J Biol Chem. 2011 Feb 11;286(6):4742-8. doi: 10.1074/jbc.M110.166348. Epub 2010 Nov 4. J Biol Chem. 2011. PMID: 21051536 Free PMC article.
-
An expanded seed sequence definition accounts for full regulation of the hid 3' UTR by bantam miRNA.RNA. 2009 May;15(5):814-22. doi: 10.1261/rna.1565109. Epub 2009 Mar 12. RNA. 2009. PMID: 19286629 Free PMC article.
References
-
- Bordeleau M.E., Mori A., Oberer M., Lindqvist L., Chard L.S., Higa T., Belsham G.J., Wagner G., Tanaka J., Pelletier J. Functional characterization of IRESes by an inhibitor of the RNA helicase eIF4A. Nat. Chem. Biol. 2006;2:213–220. - PubMed
-
- Chendrimada T.P., Finn K.J., Ji X., Baillat D., Gregory R.I., Liebhaber S.A., Pasquinelli A.E., Shiekhattar R. MicroRNA silencing through RISC recruitment of eIF6. Nature. 2007;447:823–828. - PubMed
Publication types
MeSH terms
Substances
Grants and funding
LinkOut - more resources
Full Text Sources
Miscellaneous