

Reducing bias from test misclassification in burden of disease studies: use of test to actual positive ratio--new test parameter
- PMID: 18581619
- PMCID: PMC2443625
- DOI: 10.3325/cmj.2008.3.402
Reducing bias from test misclassification in burden of disease studies: use of test to actual positive ratio--new test parameter
Abstract
Aim: To address the problem of estimating disease frequency identified by a diagnostic test, which may not represent the actual number of persons with disease in a community, but rather the number of persons who tested positive. Those two values may be very different, their relationship depending on the properties of the diagnostic test applied and true prevalence of the disease in a population.
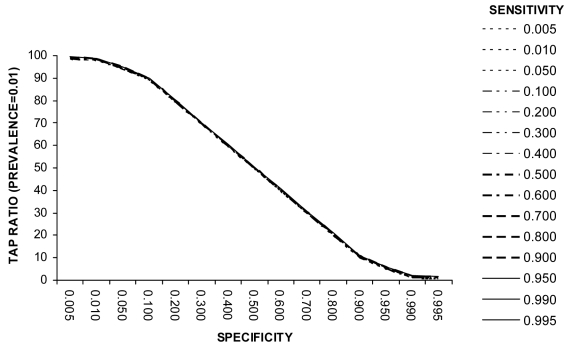
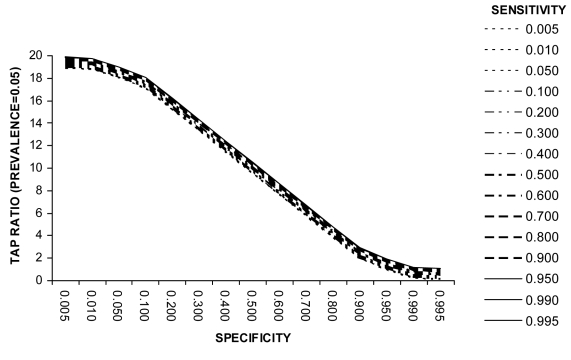
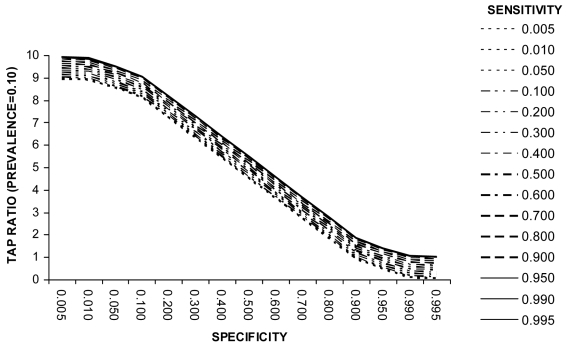
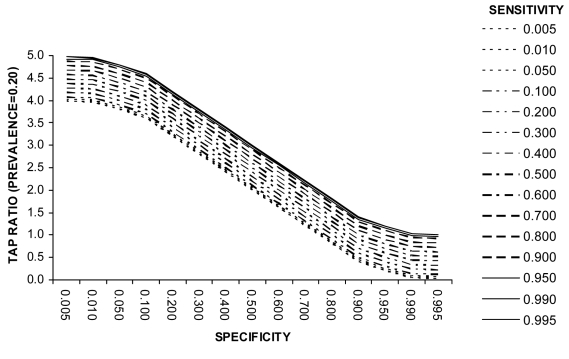
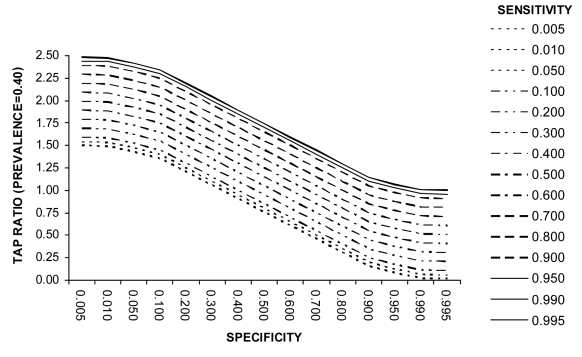
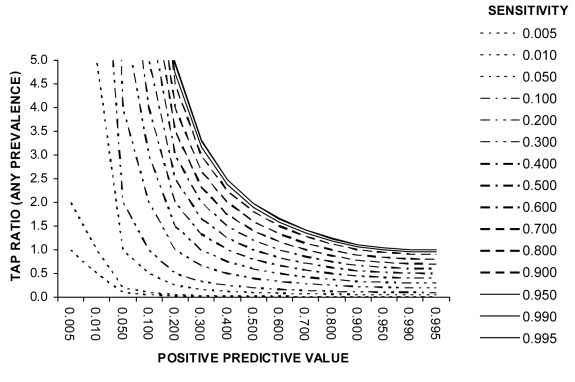
Methods: We defined a new test parameter, the ratio of Test to Actual Positives (TAP), which summarizes the properties of the diagnostic test applied and true prevalence of the disease in a population, and propose that is the most useful summary measure of the potential for bias in disease frequency estimates.
Results: A consideration of the relationship between the sensitivity (Se) and specificity (Sp) of the diagnostic test and the true prevalence of disease in a population can inform study design by highlighting the potential for disease misclassification bias. The effects of a decrease in Sp on the TAP ratio at very low disease prevalence are dramatic, as at 80% Sp (and any Se value including 100%), the measured disease frequency will represent a 25-fold overestimate. At a disease prevalence of 0.10, the Sp needs to be 90% or greater to achieve a TAP ratio of 1.0. However, unlike at lower levels of disease prevalence, the test Se is also an important determinant of the TAP ratio. A TAP ratio of 1.0 can be achieved by a Sp of 95% and intermediate Se (40%-60%); or a Sp of 99% and very high Se (over 90%). This illustrates how a test with poor performance characteristics in a clinical setting can perform well in a disease burden study in a population. In circumstances in which the TAP ratio suggests a potential for a large bias, we suggest correction procedures that limit disease misclassification bias and which are often counter-intuitive. We also illustrate how these methods can improve the power of intervention studies, which define outcomes by use of a diagnostic test.
Conclusions: Optimal screening test characteristics for use in a population-based survey are likely to be different to those when the test is used in a clinical setting. Calibrating the test a priori to bring the TAP ratio closer to unity deals with the possible large bias in disease burden estimates based on application of diagnostic (screening) test.
Figures
Similar articles
-
The existence of standard-biased mortality ratios due to death certificate misclassification - a simulation study based on a true story.BMC Med Res Methodol. 2016 Jan 22;16:8. doi: 10.1186/s12874-016-0112-8. BMC Med Res Methodol. 2016. PMID: 26801235 Free PMC article.
-
Selection and Misclassification Biases in Longitudinal Studies.Front Vet Sci. 2018 May 28;5:99. doi: 10.3389/fvets.2018.00099. eCollection 2018. Front Vet Sci. 2018. PMID: 29892604 Free PMC article.
-
Diagnosing intramammary infection: Controlling misclassification bias in longitudinal udder health studies.Prev Vet Med. 2018 Feb 1;150:162-167. doi: 10.1016/j.prevetmed.2017.11.010. Epub 2017 Nov 11. Prev Vet Med. 2018. PMID: 29169686
-
Thoracic imaging tests for the diagnosis of COVID-19.Cochrane Database Syst Rev. 2020 Nov 26;11:CD013639. doi: 10.1002/14651858.CD013639.pub3. Cochrane Database Syst Rev. 2020. Update in: Cochrane Database Syst Rev. 2021 Mar 16;3:CD013639. doi: 10.1002/14651858.CD013639.pub4. PMID: 33242342 Updated.
-
Diagnostic accuracy measures.Cerebrovasc Dis. 2013;36(4):267-72. doi: 10.1159/000353863. Epub 2013 Oct 16. Cerebrovasc Dis. 2013. PMID: 24135733 Review.
Cited by
-
Measuring coverage in MNCH: validating women's self-report of emergency cesarean sections in Ghana and the Dominican Republic.PLoS One. 2013 May 7;8(5):e60761. doi: 10.1371/journal.pone.0060761. Print 2013. PLoS One. 2013. PMID: 23667428 Free PMC article.
-
What is associated with reported acute respiratory infection in children under 5 and PCV vaccination in children aged 1-36 months in Malawi? A secondary data analysis using the Malawi 2014 MICS survey.PLoS One. 2023 Mar 31;18(3):e0283760. doi: 10.1371/journal.pone.0283760. eCollection 2023. PLoS One. 2023. PMID: 37000716 Free PMC article.
-
Can surveys of women accurately track indicators of maternal and newborn care? A validity and reliability study in Kenya.J Glob Health. 2016 Dec;6(2):020502. doi: 10.7189/jogh.06.020502. J Glob Health. 2016. PMID: 27606061 Free PMC article.
-
Estimating the number of probable new SARS-CoV-2 infections among tested subjects from the number of confirmed cases.BMC Med Res Methodol. 2023 Nov 17;23(1):272. doi: 10.1186/s12874-023-02077-2. BMC Med Res Methodol. 2023. PMID: 37978439 Free PMC article.
-
Role of point of care Hb diagnostic devices in getting the right picture of anemia control: Tangi Rural Anemia Diagnostic Accuracy Study.J Drug Assess. 2018 Jun 21;7(1):34-42. doi: 10.1080/21556660.2018.1487446. eCollection 2018. J Drug Assess. 2018. PMID: 29963327 Free PMC article.
References
-
- Mishra RN, Mishra CP, Reddy DC, Gupta VM. Estimating true burden of disease detected by screening tests of varying validity. Indian J Public Health. 2001;45:14–9. - PubMed
Publication types
MeSH terms
LinkOut - more resources
Full Text Sources
Medical
Miscellaneous