

Tracking the spatial diffusion of influenza and norovirus using telehealth data: a spatiotemporal analysis of syndromic data
- PMID: 18582364
- PMCID: PMC2464582
- DOI: 10.1186/1741-7015-6-16
Tracking the spatial diffusion of influenza and norovirus using telehealth data: a spatiotemporal analysis of syndromic data
Abstract
Background: Telehealth systems have a large potential for informing public health authorities in an early stage of outbreaks of communicable disease. Influenza and norovirus are common viruses that cause significant respiratory and gastrointestinal disease worldwide. Data about these viruses are not routinely mapped for surveillance purposes in the UK, so the spatial diffusion of national outbreaks and epidemics is not known as such incidents occur. We aim to describe the geographical origin and diffusion of rises in fever and vomiting calls to a national telehealth system, and consider the usefulness of these findings for influenza and norovirus surveillance.
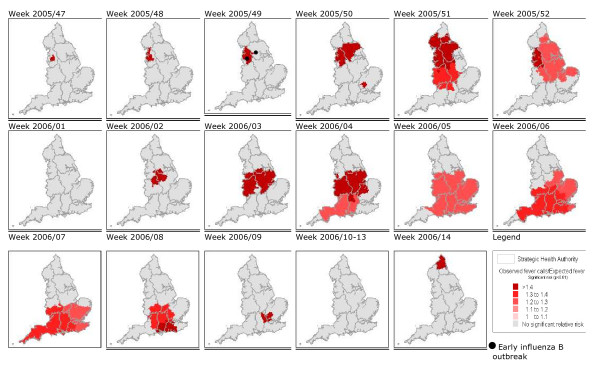
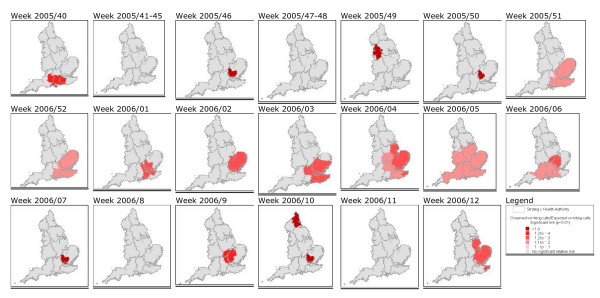
Methods: Data about fever calls (5- to 14-year-old age group) and vomiting calls (> or = 5-year-old age group) in school-age children, proxies for influenza and norovirus, respectively, were extracted from the NHS Direct national telehealth database for the period June 2005 to May 2006. The SaTScan space-time permutation model was used to retrospectively detect statistically significant clusters of calls on a week-by-week basis. These syndromic results were validated against existing laboratory and clinical surveillance data.
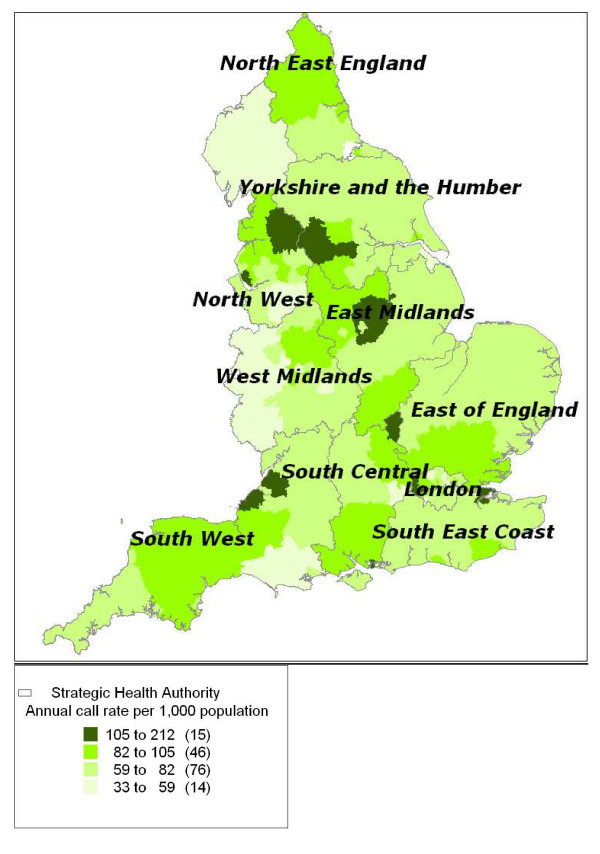
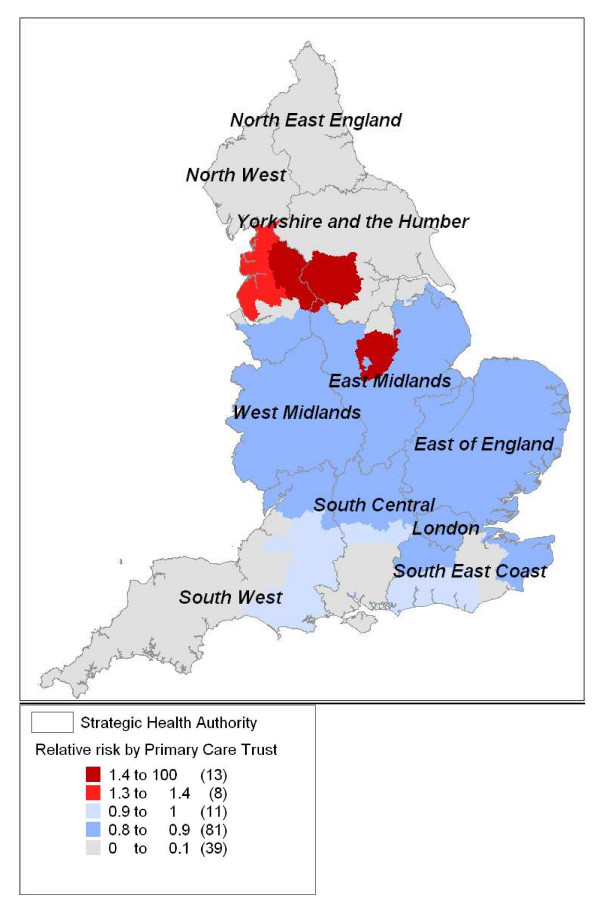
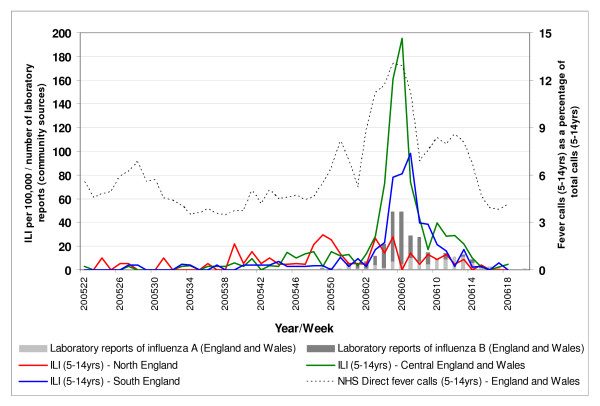
Results: We identified two distinct periods of elevated fever calls. The first originated in the North-West of England during November 2005 and spread in a south-east direction, the second began in Central England during January 2006 and moved southwards. The timing, geographical location, and age structure of these rises in fever calls were similar to a national influenza B outbreak that occurred during winter 2005-2006. We also identified significantly elevated levels of vomiting calls in South-East England during winter 2005-2006.
Conclusion: Spatiotemporal analyses of telehealth data, specifically fever calls, provided a timely and unique description of the evolution of a national influenza outbreak. In a similar way the tool may be useful for tracking norovirus, although the lack of consistent comparison data makes this more difficult to assess. In interpreting these results, care must be taken to consider other infectious and non-infectious causes of fever and vomiting. The scan statistic should be considered for spatial analyses of telehealth data elsewhere and will be used to initiate prospective geographical surveillance of influenza in England.
Figures
References
-
- Henning KJ. What is syndromic surveillance? MMWR Morb Mortal Wkly Rep. 2004;24:5–11.
-
- Heffernan R, Mostashari F, Das D, Karpati A, Kulldorff M, Weiss D. Syndromic surveillance in public health practice, New York City. Emerg Infect Dis. 2004;10:858–864. - PubMed
-
- Steiner-Sichel L, Greenko J, Heffernan R, Layton M, Weiss D. Field investigations of emergency department syndromic surveillance signals – New York City. MMWR Morb Mortal Wkly Rep. 2004;24:184–189. - PubMed
-
- Goddard NL, Kyncl J, Watson JM. Appropriateness of thresholds currently used to describe influenza activity in England. Commun Dis Public Health. 2003;6:238–245. - PubMed
-
- Tompkins DS, Hudson MJ, Smith HR, Eglin RP, Wheeler JG, Brett MM, Owen RJ, Brazier JS, Cumberland P, King V, Cook PE. A study of infectious intestinal disease in England: microbiological findings in cases and controls. Commun Dis Public Health. 1999;2:108–113. - PubMed
MeSH terms
LinkOut - more resources
Full Text Sources
Medical
