

The effects of protein interactions, gene essentiality and regulatory regions on expression variation
- PMID: 18582382
- PMCID: PMC2474594
- DOI: 10.1186/1752-0509-2-54
The effects of protein interactions, gene essentiality and regulatory regions on expression variation
Abstract
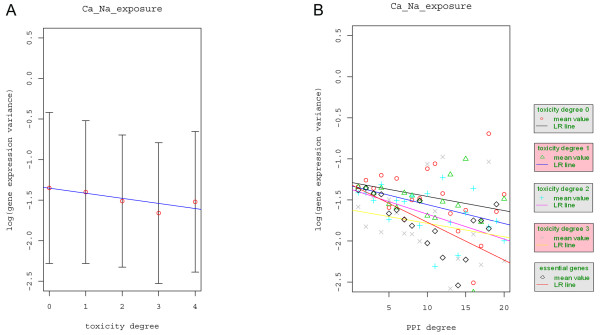
Background: Identifying factors affecting gene expression variation is a challenging problem in genetics. Previous studies have shown that the presence of TATA box, the number of cis-regulatory elements, gene essentiality, and protein interactions significantly affect gene expression variation. Nonetheless, the need to obtain a more complete understanding of such factors and how their interactions influence gene expression variation remains a challenge. The growth rates of yeast cells under several DNA-damaging conditions have been studied and a gene's toxicity degree is defined as the number of such conditions that the growth rate of the yeast deletion strain is significantly affected. Since toxicity degree reflects a gene's importance to cell survival under DNA-damaging conditions, we expect that it is negatively associated with gene expression variation. Mutations in both cis-regulatory elements and transcription factors (TF) regulating a gene affect the gene's expression and thus we study the relationship between gene expression variation and the number of TFs regulating a gene. Most importantly we study how these factors interact with each other influencing gene expression variation.
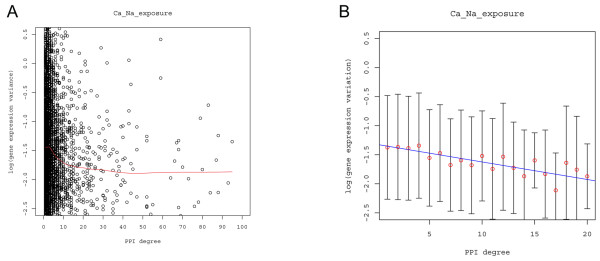
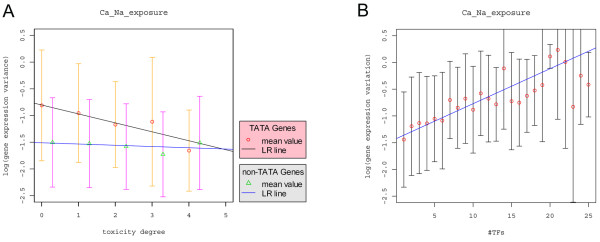
Results: Using yeast as a model system, we evaluated the effects of four separate factors and their interactions on gene expression variation: protein interaction degree, toxicity degree, number of TFs, and the presence of TATA box. Results showed that 1) gene expression variation is negatively correlated with the protein interaction degree in the protein interaction network, 2) essential genes tend to have less expression variation than non-essential genes and gene expression variation decreases with toxicity degree, and 3) the number of TFs regulating a gene is the most important factor influencing gene expression variation (R2 = 8-14%). In addition, the number of TFs regulating a gene was found to be an important factor influencing gene expression variation for both TATA-containing and non-TATA-containing genes, but with different association strength. Moreover, gene expression variation was significantly negatively correlated with toxicity degree only for TATA-containing genes.
Conclusion: The finding that distinct mechanisms may influence gene expression variation in TATA-containing and non-TATA-containing genes, provides new insights into the mechanisms that underlie the evolution of gene expression.
Figures
References
-
- Lemos B, Bettencourt BR, Meiklejohn CD, Hartl DL. Evolution of proteins and gene expression levels are coupled in Drosophila and are independently associated with mRNA abundance, protein length, and number of protein-protein interactions. Mol Biol Evol. 2005;22:1345–54. doi: 10.1093/molbev/msi122. - DOI - PubMed
Publication types
MeSH terms
Substances
Grants and funding
LinkOut - more resources
Full Text Sources
Molecular Biology Databases
Miscellaneous
