. 2008 Aug 26;155(3):818-32.
doi: 10.1016/j.neuroscience.2008.05.037. Epub 2008 Jun 5.

Localization of electrogenic Na/bicarbonate cotransporter NBCe1 variants in rat brain

Affiliations

Localization of electrogenic Na/bicarbonate cotransporter NBCe1 variants in rat brain

D Majumdar et al. Neuroscience. .

Abstract

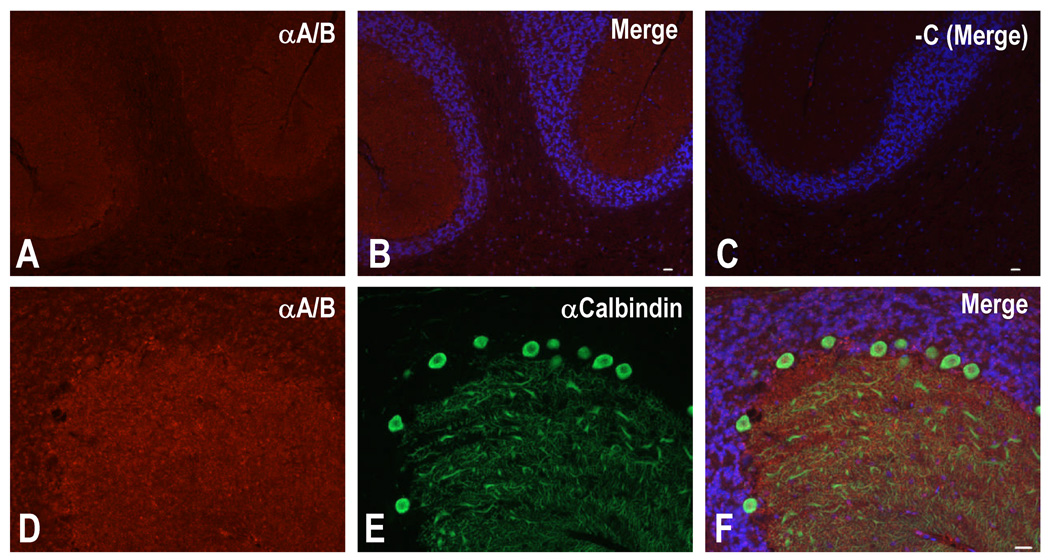
The activity of HCO(3)(-) transporters contributes to the acid-base environment of the nervous system. In the present study, we used in situ hybridization, immunoblotting, immunohistochemistry, and immunogold electron microscopy to localize electrogenic Na/bicarbonate cotransporter NBCe1 splice variants (-A, -B, and -C) in rat brain. The in situ hybridization data are consistent with NBCe1-B and -C, but not -A, being the predominant NBCe1 variants in brain, particularly in the cerebellum, hippocampus, piriform cortex, and olfactory bulb. An antisense probe to the B and C variants strongly labeled granule neurons in the dentate gyrus of the hippocampus, and cells in the granule layer and Purkinje layer (e.g. Bergmann glia) of the cerebellum. Weaker labeling was observed in the pyramidal layer of the hippocampus and in astrocytes throughout the brain. Similar, but weaker labeling was obtained with an antisense probe to the A and B variants. In immunoblot studies, antibodies to the A and B variants (alphaA/B) and C variant (alphaC) labeled approximately 130-kDa proteins in various brain regions. From immunohistochemistry data, both alphaA/B and alphaC exhibited diffuse labeling throughout brain, but alphaA/B labeling was more intracellular and punctate. Based on co-localization studies with antibodies to neuronal or astrocytic markers, alphaA/B labeled neurons in the pyramidal layer and dentate gyrus of the hippocampus, as well as cortex. alphaC labeled glia surrounding neurons (and possibly neurons) in the neuropil of the Purkinje cell layer of the cerebellum, the pyramidal cell layer and dentate gyrus of the hippocampus, and the cortex. According to electron microscopy data from the cerebellum, alphaA/B primarily labeled neurons intracellularly and alphaC labeled astrocytes at the plasma membrane. In summary, the B and C variants are the predominant NBCe1 variants in rat brain and exhibit different localization profiles.


Figures

Fig. 1
Fig. 1
In situ hybridization probes and rabbit polyclonal antibodies for localizing NBCe1-A, -B, and -C variants in rat brain. The cDNA and protein diagrams are not drawn to scale. Antisense and sense A probes recognize the unique 5' ORF (bp 1–123) that encodes the unique amino-terminal 41 residues of the A variant. Antisense and sense B/C probes recognize the different 5' ORF (bp 1–255) that encodes the different amino-terminal 85 residues of the B and C variants. Antisense and sense A/B probes recognize the 97-bp region near the 3' end of the ORF found in the A and B variants, but not the C variant. Two different rabbit polyclonal antibodies previously characterized (Bevensee et al., 2000) distinguish between the C-terminal 46 residues of the A and B variants (αA/B antibody) and the unique C-terminal 61 residues of the C variant (αC antibody).
Fig. 2
Fig. 2
Localization of mRNA encoding NBCe1 variants in rat brain. (A–D) A specific antisense probe to the 5' ORF of NBCe1-A. Little NBCe1-A mRNA was detected throughout brain (A), including the cerebellum (B) and the hippocampus (C). As a positive control, the antisense probe labeled the outer cortex and proximal tubules near the glomerulus (G) of rat kidney (D). (E–J) A specific antisense probe to the 5' ORF of NBCe1-B/C variants. NBCe1-B/C mRNA was present throughout brain, particularly in the cerebellum and hippocampus, as well as the olfactory bulb (OB) shown in the inset (E). Minimal labeling was obtained with the sense probe (F). NBCe1-B/C mRNA was prominent in (i) the granular and Purkinje layers of the cerebellum (G, H), especially Bergmann glia in the Purkinje layer (H), and (ii) the dentate gyrus of the hippocampus (I). NBCe1-B/C mRNA was less pronounced in the pyramidal layer of the hippocampus (J). (K–N) A specific antisense probe to the 3' ORF of NBCe1-A/B variants. NBCe1-A/B mRNA was present throughout brain (K), as well as cerebellum (M) and hippocampus (N), in a pattern similar to that seen with the B/C antisense probe. Minimal labeling was obtained with the sense probe (L). Numbers above scale bars in panels are in micrometers.
Fig. 3
Fig. 3
Expression of NBCe1 variants in tissue homogenates from different regions of rat brain. (A, top) A commercially available blot containing total protein from various brain regions probed with 1:500 αA/B. NBCe1-A/B is ~130 kDa. (A, bottom) The same commercial blot was reprobed with 1:5000 αβ-actin. Intensity of αA/B labeling normalized to that of αβ-actin is shown as αA/B:αβ-actin. (B) The blot probed with 1:2000 αC. NBCe1-C is ~130 kDa. Intensity of αC labeling normalized to that of αβ-actin is shown as αC:αβ-actin.
Fig. 4
Fig. 4
NBCe1-A/B expression in rat cerebellum. (A–C) Fluorescence microscopy image of weak αA/B labeling in the cerebellum of a sagittal brain section. αA/B labeling of the molecular layer was slightly greater than the granule layer (A). Images of αA/B labeling and nuclear bis benzimide staining are overlaid (B). No labeling was seen in the negative control without primary antibody (C). Scale bar = 20 µm for A–C. (D–F) Fluorescence microscopy image of double labeling by αA/B (D) and αCalbindin (1:1K) (E) in the cerebellum of a sagittal brain section. There was minimal colocalization seen in the merged figure (F). Scale bar = 20 µm for D–F.
Fig. 5
Fig. 5
NBCe1-C expression in rat cerebellum. (A–C) Fluorescence microscopy image of αC labeling in the cerebellum of a sagittal brain section. αC labeled the granule and the Purkinje cell layers (A). Images of αC labeling and nuclear bis benzimide staining are overlaid (B). No labeling was seen in the negative control without primary antibody (C). Scale bar = 20 µm for A–C. (D–F) Fluorescence microscopy image of double labeling of αC and αCalbindin (1:1K) in the cerebellum of a sagittal brain section. Colocalization of αC (D) and αCalbindin (E) was consistent with NBCe1-C expression around the Purkinje neurons as seen in the merged image (F). Scale bar = 10 µm for D–F. (G–I) Fluorescence microscopy image showing the specificity of αC labeling in the cerebellum of a sagittal brain section. αC labeling (G) was reduced by preabsorption with 100 µg/ml fusion protein (H,I). Scale bar = 20 µm for G–I. (J–O) Fluorescence microscopy images of double labeling by αC and αGLAST (1:500) at lower (J–L) and higher (M–O) magnifications in the cerebellum of a sagittal brain section. Colocalization of αC (J,M) and αGLAST (K,N) was consistent with NBCe1-C expression in glia within the Purkinje cell layer as seen in the merged image (L, O). Scale bars = 20 µm for J–L, and 10 µm for M–O.
Fig. 6
Fig. 6
NBCe1-A/B expression in rat hippocampus. (A–D) Fluorescence microscopy image of intracellular αA/B labeling in the hippocampus of a sagittal brain section. αA/B (A) exhibited punctate intracellular labeling in the pyramidal cell layer and the dentate gyrus of the hippocampus. Images of αA/B labeling (A) and nuclear bis benzimide staining (B) are overlaid (C). No labeling was seen in the negative control without primary antibody (D). Scale bar = 100 µm for A–D. (E–H) Fluorescence microscopy image of intracellular αA/B labeling in the CA1 layer of a sagittal brain section. Images of αA/B labeling (E) and nuclear bis benzimide staining (F) are overlaid (G). No labeling was seen in the negative control without primary antibody (H). Scale bar = 10 µm for E–H. (I–L) Fluorescence microscopy image showing the specificity of αA/B labeling in the CA1 layer of a sagittal brain section. αA/B labeling (I,J) was reduced by preabsorption with 50 µg/ml fusion protein (K,L). Scale bar = 20 µm for I–L. (M–P) Fluorescence microscopy image of intracellular αA/B labeling in the CA3a layer of a sagittal brain section. Colocalization of αA/B (M) and αMAP2 (1:100K) (N) was consistent with NBCe1-A/B expression in the pyramidal cells as seen in the merged image (O). No labeling was seen in the negative control without primary antibody (P). Scale bar = 20 µm for M–P. (Q–T) Fluorescence microscopy image of distinct αA/B and αGFAP (1:5K) labeling in the CA3a layer of sagittal brain section. αA/B (Q) and αGFAP (R) did not colocalize– a finding consistent with the absence of NBCe1-A/B in astrocytes as seen in the merged image (S). No labeling was seen in the negative control without primary antibody (T). Scale bar = 20 µm for Q–T.
Fig. 7
Fig. 7
NBCe1-C expression in rat hippocampus. (A–D) Fluorescence microscopy image of αC labeling in the hippocampus of a sagittal brain section. αC (A) labeled the pyramidal cell layer and dentate gyrus. Images of αC labeling (A) and nuclear bis benzimide staining (B) are overlaid (C). No labeling was seen in the negative control without primary antibody (D). Scale bar = 100 µm for A–D. (E–H) Fluorescence microscopy image of rim-like αC labeling in the CA1 layer of the hippocampus of a coronal brain section. Images of αC labeling (E) and nuclear bis benzimide staining (F) are overlaid (G). No labeling was seen in the negative control without primary antibody (H). Scale bar = 10 µm for E–H. (I–K) Confocal microscopy image of αC labeling in the inner hilar portion of the dentate gyrus of a coronal brain section. Images of αC labeling (I) and nuclear bis benzimide staining (J) are overlaid (K). Scale bar = 100 µm for I–K. (L–N) Confocal microscopy image of double labeling by αC and αNeuN (1:5K) in the CA1 layer of the hippocampus of a sagittal brain section. Colocalization of αC (L) and αNeuN (M) was consistent with NBCe1-C expression around the pyramidal neurons as seen in the merged image (N). Scale bar = 50 µm for L–N. (O–T) Fluorescence microscopy images of double labeling of αC and αGLAST (1:500) in the hippocampus of a sagittal brain section. Colocalization of αC (O, R) and αGLAST (P, S) in the CA1/CA2 layer (O–Q) and granule layer of the dentate gyrus (R–T) was consistent with NBCe1-C expression in glia as seen in the merged images (Q, T). Scale bar = 10 µm for (O–Q) and 20 µm for (R–T).
Fig. 8
Fig. 8
NBCe1-A/B and -C expression in the rat cortex. (A–D) Fluorescence microscopy image of αA/B labeling in the cortex of a sagittal brain section. Colocalization of αA/B (A) and αMAP2 (1:100K) (B) was consistent with NBCe1-A/B expression in the cortical neurons as seen in the merged image (C). Strong colocalization was evident in several neurons identified by the white arrows. No labeling was seen in the negative control without primary antibody (D). Scale bar = 20 µm for A–D. (E–H) Fluorescence microscopy image of αC labeling in the cortex of a sagittal brain section. Colocalization of αC (E) and αNeuN (1:5K) (F) was consistent with NBCe1-C expression around the cortical neurons as seen in the merged image (G) No labeling was seen in the negative control without primary antibody (H). Scale bar = 20 µm for E–H. (I–L) Fluorescence microscopy image of distinct αC and αGLAST (1:500) labeling in the cortex of a sagittal brain section. αC (I) and αGLAST (J) colocalized as seen in the merged image (K)— a finding consistent with the presence of NBCe1-C in glia surrounding neurons. No labeling was seen in the negative control without primary antibody (L). Scale bar = 20 µm for I–L.
Fig. 9
Fig. 9
NBCe1-C and -A/B expression in the Purkinje layer of rat cerebellum. (A–C) Immunoelectron micrographs demonstrating the subcellular localization of NBCe1-C (A,B) and NBCe1-A/B (C) at the subcellular level. The colloidal gold particles conjugated to the secondary antibody (arrowheads) mark αC labeling of the plasma membrane of a glial cell and are located either directly over or immediately adjacent to the glial membrane profile (A,B). The inset in the bottom, right corner of panel A shows a zoomed-in view of the region identified by the dotted rectangle. This glial cell (G) has a complex shape as illustrated in the cross-section (B) where the cytoplasm is labeled blue. Little or no αC label is associated with adjacent nerve cell profiles (N). In contrast, αA/B is preferentially located in the cytoplasm of some, but not all, nerve fibers (N) observed in the section (C). Scale bar = 1 µm for A–C.

Similar articles

Cited by

References

    1. Aalkjær C, Frische S, Leipziger J, Nielsen S, Praetorius J. Sodium coupled bicarbonate transporters in the kidney, an update. Acta Physiol Scand. 2004;181:505–512. - PubMed
    1. Abuladze N, Lee I, Newman D, Hwang J, Boorer K, Pushkin A, Kurtz I. Molecular cloning, chromosomal localization, tissue distribution, and functional expression of the human pancreatic sodium bicarbonate cotransporter. J Biol Chem. 1998a;273:17689–17695. - PubMed
    1. Abuladze N, Lee I, Newman D, Hwang J, Pushkin A, Kurtz I. Axial heterogeneity of sodium-bicarbonate cotransporter expression in the rabbit proximal tubule. Am J Physiol. 1998b;274:F628–F633. - PubMed
    1. Berger UV, Hediger MA. Differential distribution of the glutamate transporters GLT-1 and GLAST in tanycytes of the third ventricle. J Comp Neurol. 2001;433:101–114. - PubMed
    1. Bevensee MO, Apkon M, Boron WF. Intracellular pH regulation in cultured astrocytes from rat hippocampus. II. Electrogenic Na/HCO3 cotransport. J Gen Physiol. 1997a;110:467–483. - PMC - PubMed

Publication types