

Quantitative assessment of macromolecular concentration during direct infusion into an agarose hydrogel phantom using contrast-enhanced MRI
- PMID: 18583082
- PMCID: PMC3140426
- DOI: 10.1016/j.mri.2008.04.011
Quantitative assessment of macromolecular concentration during direct infusion into an agarose hydrogel phantom using contrast-enhanced MRI
Abstract
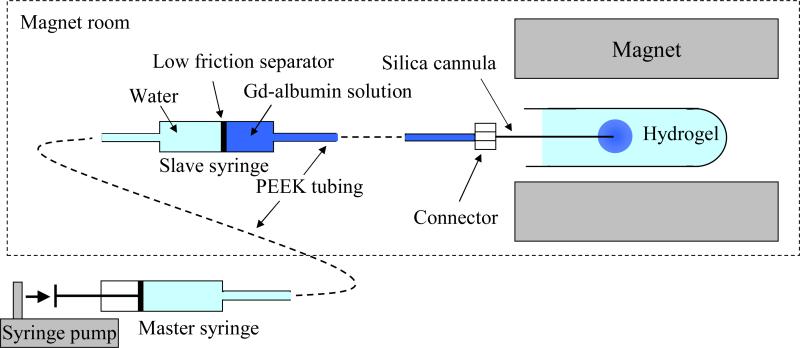
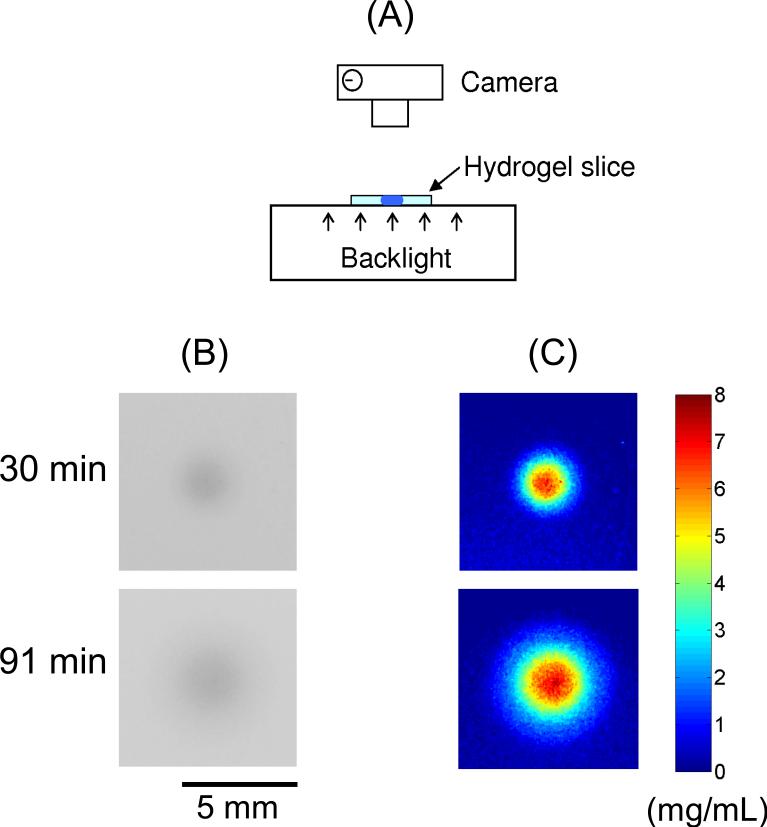
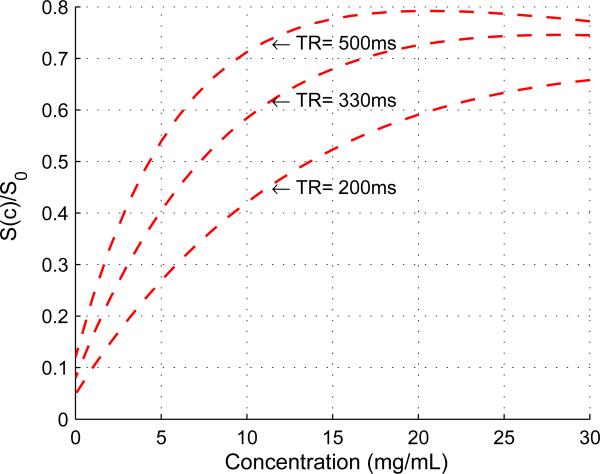
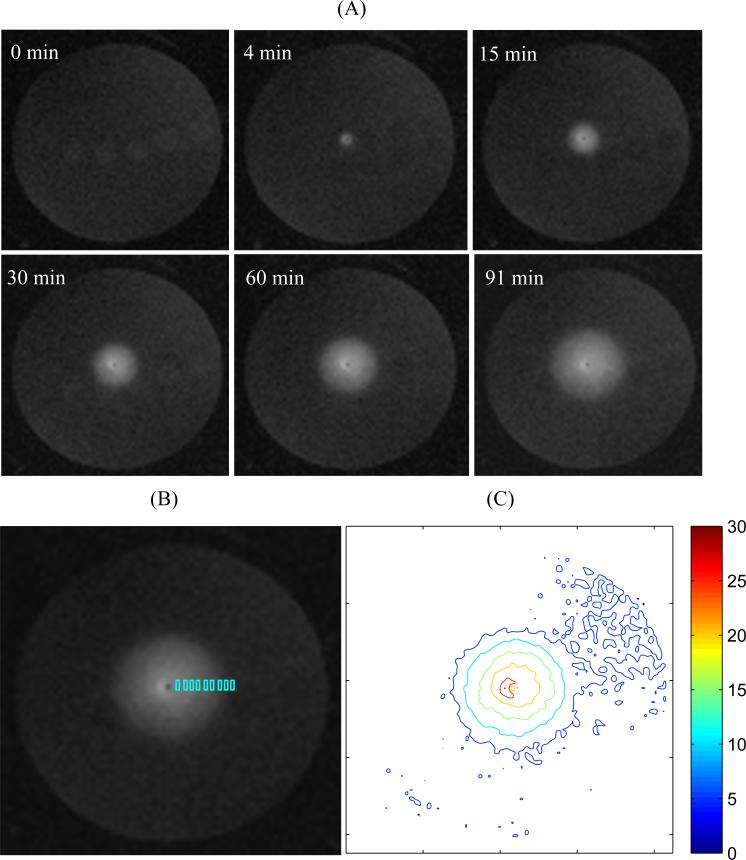
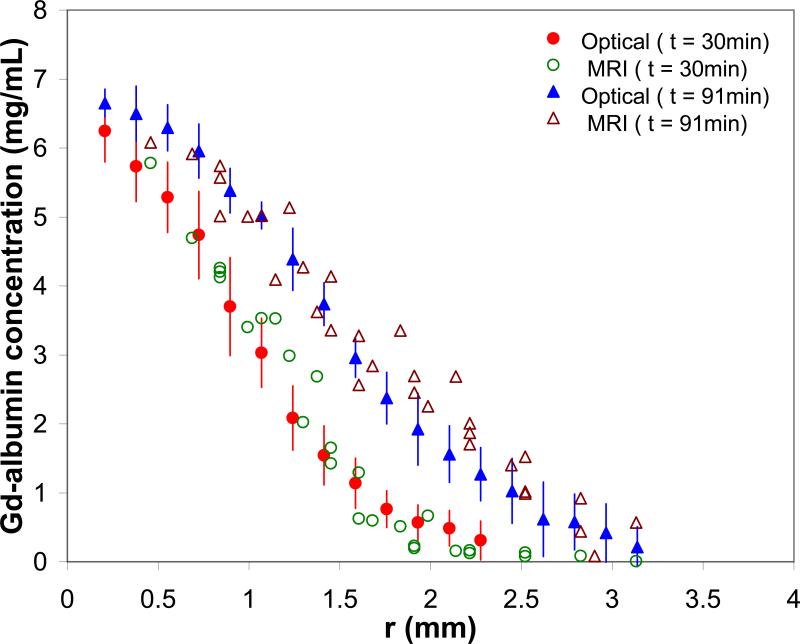
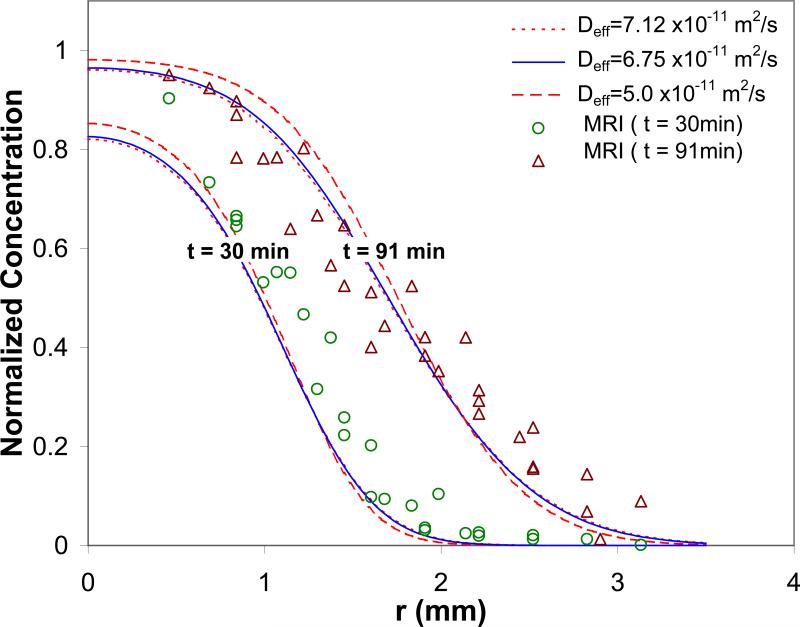
Convection-enhanced delivery (CED), that is, direct tissue infusion, has emerged as a promising local drug delivery method for treating diseases of the nervous system. Determination of the spatial distribution of therapeutic agents after infusion is important in evaluating the efficacy of treatment, optimizing infusion protocols and improving the understanding of drug pharmacokinetics. In this study, we provide a methodology to determine the concentration distribution of Gd-labeled tracers during infusion using contrast-enhanced magnetic resonance imaging (MRI). To the best of our knowledge, MR studies that quantify concentration profiles for CED have not been previously reported. The methodology utilizes intrinsic material properties (T(1) and R(1)) and reduces the effect of instrumental factors (e.g., inhomogeneity of MR detection field). As a methodology investigation, this study used an agarose hydrogel phantom as a tissue substitute for infusion. An 11.1-T magnet system was used to image infusion of Gd-DTPA-labeled albumin (Gd-albumin) into the hydrogel. By using data from preliminary scans, Gd-albumin distribution was determined from the signal intensity of the MR images. As a validation test, MR-derived concentration profiles were found comparable to both results measured directly using quantitative optical imaging and results from a computational transport model in porous media. In future studies, the developed methodology will be used to quantitatively monitor the distribution of Gd tracer following infusion directly into tissues.
Figures
References
-
- Lieberman DM, Laske DW, Morrison PF, Bankiewicz KS, Oldfield EH. Convection-enhanced distribution of large molecules in gray matter during interstitial drug infusion. J Neurosurg. 1995;82(6):1021–1029. - PubMed
-
- Lonser RR, Walbridge S, Butman JA, Walters HA, Garmestani K, Vortmeyer AO, Brechbiel MW, Oldfield EH. Successful safe perfusion of the primate brainstem with a macromolecule: In vivo magnetic resonance imaging of macromolecular distribution during infusion. Neurosurg. 2002;51(2):551–551. - PubMed
-
- Wood JD, Lonser RR, Gogate N, Morrison PF, Oldfield EH. Convective delivery of macromolecules into the naive and traumatized spinal cords of rats. J Neurosurg. 1999;90(1):115–120. - PubMed
-
- Patel SJ, Shapiro WR, Laske DW, Jensen RL, Asher AL, Wessels BW, Carpenter SP, Shan JS. Safety and feasibility of convection-enhanced delivery of cotara for the treatment of malignant glioma: Initial experience in 51 patients. Neurosurgery. 2005;56(6):1243–1252. - PubMed
Publication types
MeSH terms
Substances
Grants and funding
LinkOut - more resources
Full Text Sources
Medical
Research Materials
