. 2008 Oct 6;5 Suppl 2(Suppl 2):S113-21.
doi: 10.1098/rsif.2008.0177.focus.

Characterization and use of laser-based lysis for cell analysis on-chip

Affiliations

Characterization and use of laser-based lysis for cell analysis on-chip

Hsuan-Hong Lai et al. J R Soc Interface. .

Abstract

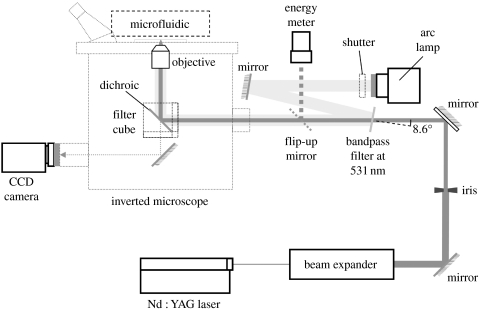
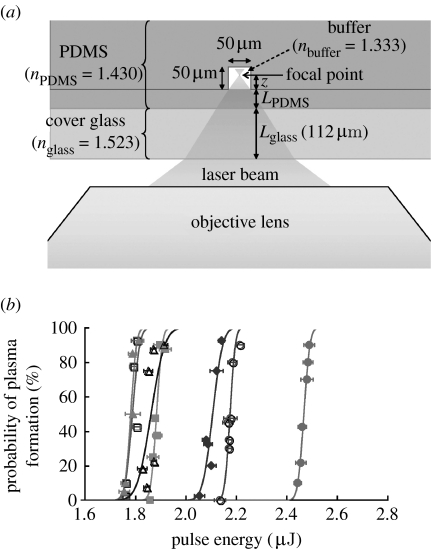
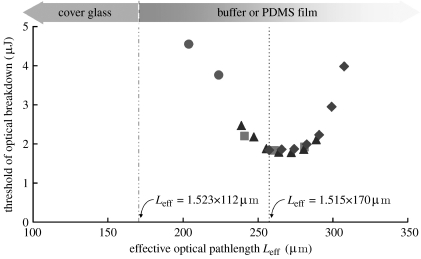
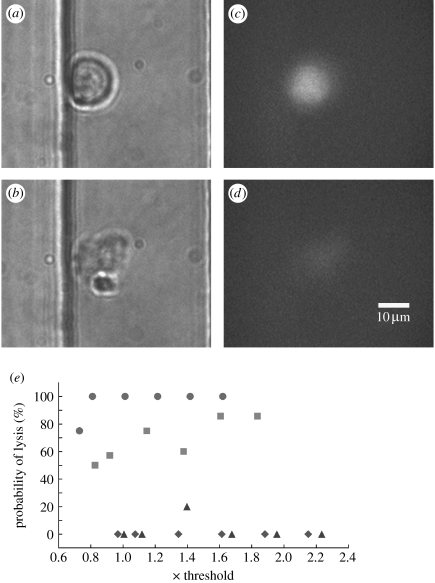
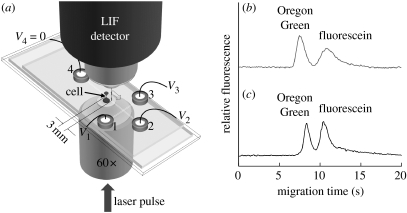
We demonstrate the use of a pulsed laser microbeam for cell lysis followed by electrophoretic separation of cellular analytes in a microfluidic device. The influence of pulse energy and laser focal point within the microchannel on the threshold for plasma formation was measured. The thickness of the poly(dimethylsiloxane) (PDMS) layer through which the beam travelled was a critical determinant of the threshold energy. An effective optical path length, Leff, for the laser beam can be used to predict the threshold for optical breakdown at different microchannel locations. A key benefit of laser-based cell lysis is the very limited zone (less than 5 microm) of lysis. A second asset is the rapid cell lysis times (approx. microseconds). These features enable two analytes, fluorescein and Oregon Green, from a cell to be electrophoretically separated in the channel in which cell lysis occurred. The resolution and efficiency of the separation of the cellular analytes are similar to those of standards demonstrating the feasibility of using a pulsed laser microbeam in single-cell analysis.


Figures

Figure 1
Figure 1
Schematic of the optical delivery system for the laser beam.
Figure 2
Figure 2
Formation of a plasma within a microchannel. (a) Schematic of the objective and microdevice used to determine the probability of plasma formation within a microchannel. (b) Curves of the probability of plasma formation with respect to the pulse energy with the laser focused at 6 μm (solid circles), 13 μm (open circles), 19 μm (solid squares), 25 μm (open squares), 31 μm (solid triangles), 38 μm (open triangles) and 44 μm (solid diamonds) above the bottom of the channel were constructed. The PDMS thickness between the coverslip and the channel bottom was 42 μm. The thickness of the coverslip was 112 μm. The lines are the best fits of the data to a Gaussian error function.
Figure 3
Figure 3
Dependence of the threshold for plasma formation on Leff. The threshold of optical breakdown in an ECB-filled microchannel was measured at different heights above the bottom of the channel. The floor of the channel was a coverslip coated with a PDMS film of varying thickness (circles, 0 μm, (bare glass); squares, 40 μm; triangles, 42 μm; diamonds, 55 μm). Leff was calculated for the different focal points of the beam as well as the PDMS thickness and then plotted against the threshold for plasma formation.
Figure 4
Figure 4
Cell lysis in a microchannel with a pulsed laser beam. (a,b) Transmitted light and (c,d) fluorescence images of a cell (a,c) before and (b,d) after cell lysis. The focal point of the laser pulse (4.2 μJ) was 6 μm above the bottom of the microchannel. (e) Graphs of the pulse energy versus percentage of cells lysed with respect to laser focus location z (circles, 6 μm; squares, 13 μm; triangles, 25 μm; diamonds, 38 μm), which was measured relative to the bottom of the PDMS microchannel. A minimum of five cells were targeted for each energy and each laser beam location.
Figure 5
Figure 5
Electrophoretic separation of the contents of a single cell in a microchannel. (a) Schematic of the microfluidic chip for separation of the cellular contents. (b) Electropherogram of fluorescein (2 μM) and Oregon Green (1 μM) standards in the isotonic buffer in the surface-modified PDMS microchannel. The migration time of fluorescein and Oregon Green standards was 11 and 8 s, respectively. (c) Electropherogram of the contents from a BA/F3 cell, which was incubated with the esterified analogues of fluorescein and Oregon Green. The fluorescence of the peaks representing fluorescein and Oregon Green was equivalent to 5.4 and 1.4 μM, respectively. The migration time of fluorescein and Oregon Green obtained from the cell was 11 and 9 s, respectively.

References

    1. Berridge M.J. Inositol trisphosphate and calcium signaling. Nature. 1993;361:315–325. doi:10.1038/361315a0 - DOI - PubMed
    1. Braschler T., Johann R., Heule M., Metref L., Renaud P. Gentle cell trapping and release on a microfluidic chip by in situ alginate hydrogel formation. Lab Chip. 2005;5:553–559. doi:10.1039/b417604a - DOI - PubMed
    1. Di Carlo D., Lee L.P. Dynamic single-cell analysis for quantitative biology. Anal. Chem. 2006;78:7918–7925. - PubMed
    1. Dovichi N.J., Hu S. Chemical cytometry. Curr. Opin. Chem. Biol. 2003;7:603–608. doi:10.1016/j.cbpa.2003.08.012 - DOI - PubMed
    1. Evander M., Johansson L., Lilliehorn T., Piskur J., Lindvall M., Johansson S., Almqvist M., Laurell T., Nilsson J. Noninvasive acoustic cell trapping in a microfluidic perfusion system for online bioassays. Anal. Chem. 2007;79:2984–2991. doi:10.1021/ac061576v - DOI - PubMed

Publication types