

Histogram analysis of MR imaging-derived cerebral blood volume maps: combined glioma grading and identification of low-grade oligodendroglial subtypes
- PMID: 18583405
- PMCID: PMC8118772
- DOI: 10.3174/ajnr.A1182
Histogram analysis of MR imaging-derived cerebral blood volume maps: combined glioma grading and identification of low-grade oligodendroglial subtypes
Abstract
Background and purpose: Inclusion of oligodendroglial tumors may confound the utility of MR based glioma grading. Our aim was, first, to assess retrospectively whether a histogram-analysis method of MR perfusion images may both grade gliomas and differentiate between low-grade oligodendroglial tumors with or without loss of heterozygosity (LOH) on 1p/19q and, second, to assess retrospectively whether low-grade oligodendroglial subtypes can be identified in a population of patients with high-grade and low-grade astrocytic and oligodendroglial tumors.
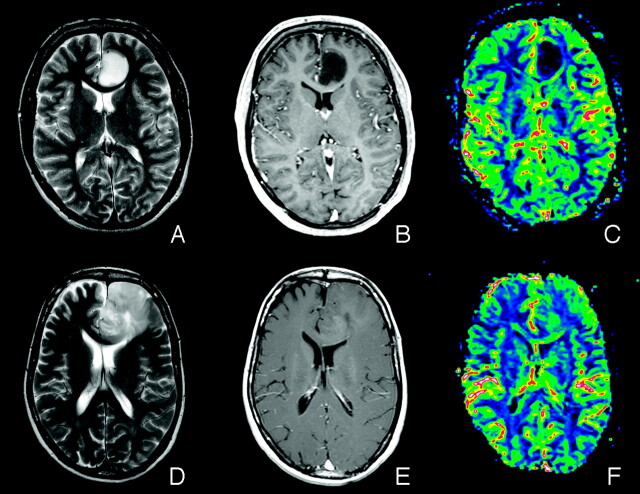
Materials and methods: Fifty-two patients (23 women, 29 men; mean age, 52 years; range, 19-78 years) with histologically confirmed gliomas were imaged by using dynamic susceptibility contrast MR imaging at 1.5T. Relative cerebral blood volume (rCBV) maps were created, and 4 neuroradiologists defined the glioma volumes independently. Averaged over the 4 observers, a histogram-analysis method was used to assess the normalized histogram peak height of the glioma rCBV distributions.
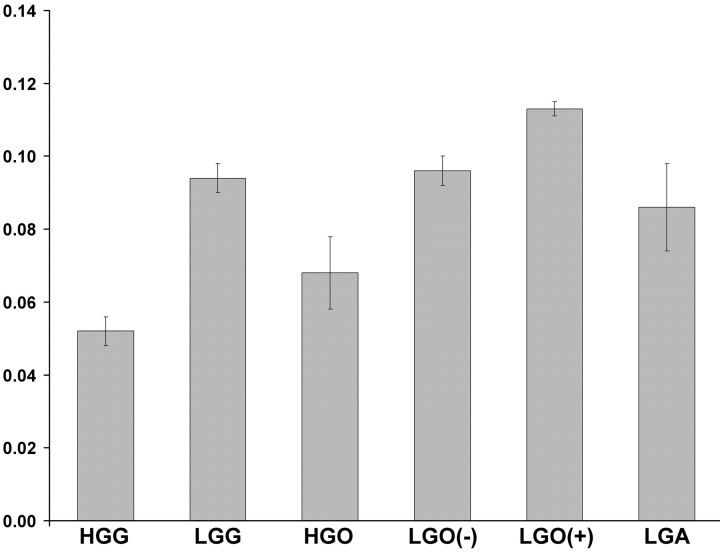
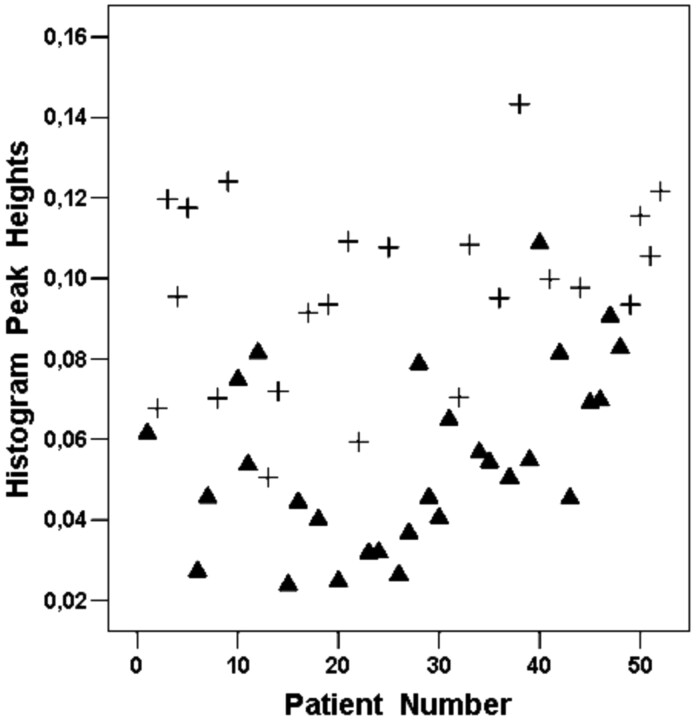
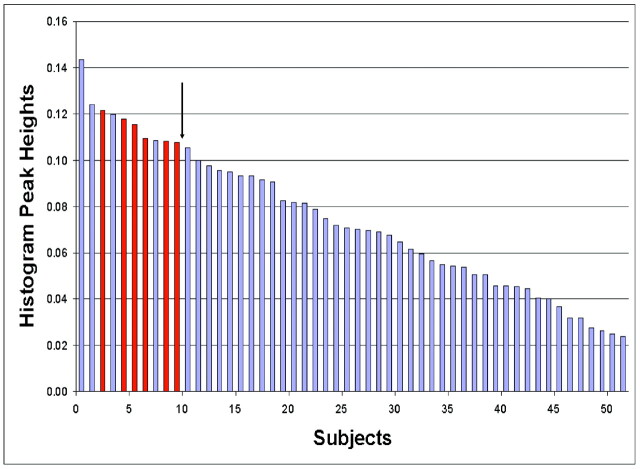
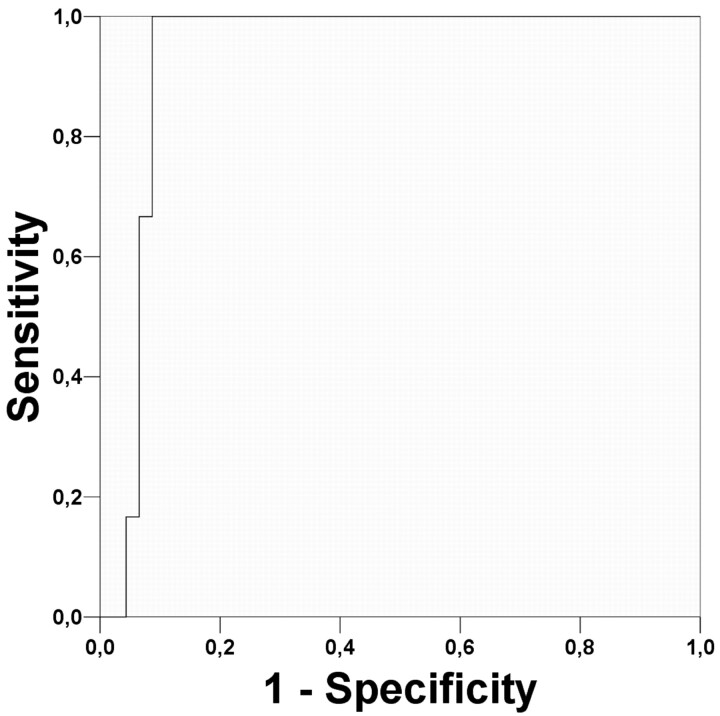
Results: Of the 52 patients, 22 had oligodendroglial tumors. The histogram method was able to differentiate high-grade gliomas (HGGs) from low-grade gliomas (LGGs) (Mann-Whitney U test, P < .001) and to identify low-grade oligodendroglial subtypes (P = .009). The corresponding intraclass correlation coefficients were 0.902 and 0.801, respectively. The sensitivity and specificity in terms of differentiating low-grade oligodendroglial tumors without LOH on 1p/19q from the other tumors was 100% (6/6) and 91% (42/46), respectively.
Conclusion: With histology as a reference, our results suggest that histogram analysis of MR imaging-derived rCBV maps can differentiate HGGs from LGGs as well as low-grade oligodendroglial subtypes with high interobserver agreement. Also, the method was able to identify low-grade oligodendroglial tumors without LOH on 1p/19q in a population of patients with astrocytic and oligodendroglial tumors.
Figures

References
-
- Lev MH, Rosen BR. Clinical applications of intracranial perfusion MR imaging. Neuroimaging Clin N Am 1999;9:309–31 - PubMed
-
- Law M, Oh S, Babb JS, et al. Low-grade gliomas: dynamic susceptibility-weighted contrast-enhanced perfusion MR imaging—prediction of patient clinical response. Radiology 2006;238:658–67 - PubMed
-
- Covarrubias DJ, Rosen BR, Lev MH. Dynamic magnetic resonance perfusion imaging of brain tumors. Oncologist 2004;9:528–37 - PubMed
-
- Edelman RR, Mattle HP, Atkinson DJ, et al. Cerebral blood flow: assessment with dynamic contrast-enhanced T2*-weighted MR imaging at 1.5 T. Radiology 1990;176:211–20 - PubMed
-
- Aronen HJ, Gazit IE, Louis DN, et al. Cerebral blood volume maps of gliomas: comparison with tumor grade and histologic findings. Radiology 1994;191:41–51 - PubMed
Publication types
MeSH terms
LinkOut - more resources
Full Text Sources
Other Literature Sources
Medical