

MR imaging findings in hepatic encephalopathy
- PMID: 18583413
- PMCID: PMC8118773
- DOI: 10.3174/ajnr.A1139
MR imaging findings in hepatic encephalopathy
Abstract
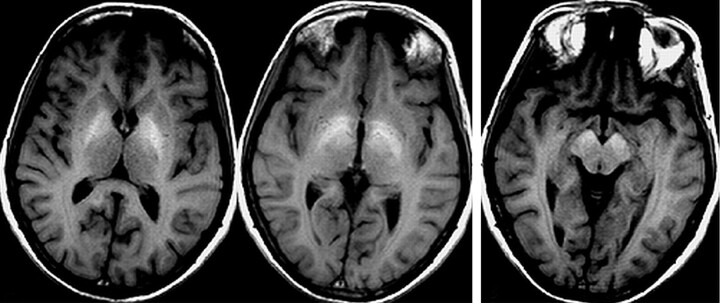
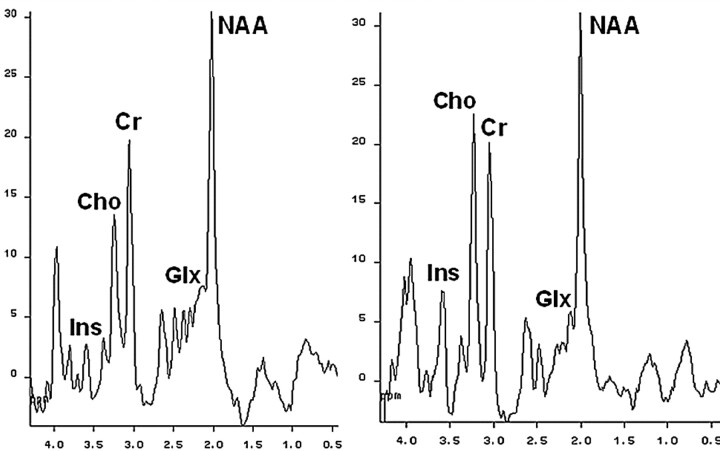
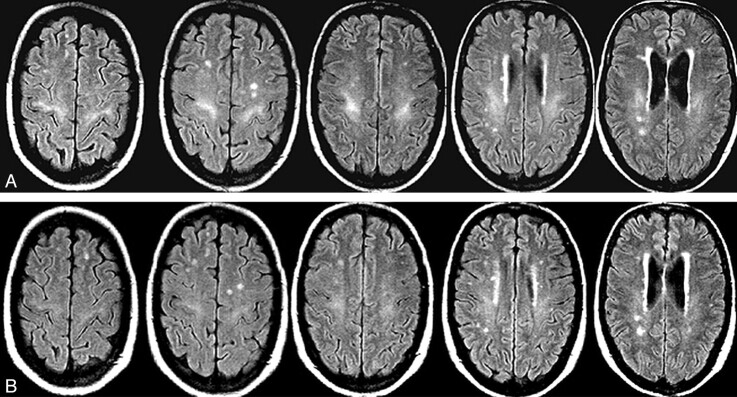
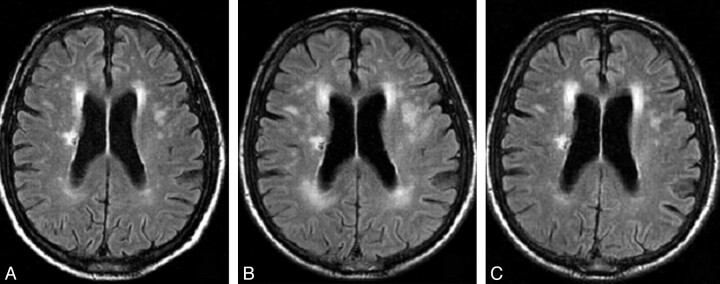
The term hepatic encephalopathy (HE) includes a spectrum of neuropsychiatric abnormalities occurring in patients with liver dysfunction. Most cases are associated with cirrhosis and portal hypertension or portal-systemic shunts, but the condition can also be seen in patients with acute liver failure and, rarely, with portal-systemic bypass and no associated intrinsic hepatocellular disease. Although HE is a clinical condition, several neuroimaging techniques, particularly MR imaging, may eventually be useful for the diagnosis because they can identify and measure the consequences of central nervous system (CNS) increase in substances that under normal circumstances, are efficiently metabolized by the liver. Classic MR imaging abnormalities include high signal intensity in the globus pallidum on T1-weighted images, likely a reflection of increased tissue concentrations of manganese, and an elevated glutamine/glutamate peak coupled with decreased myo-inositol and choline signals on proton MR spectroscopy, representing disturbances in cell-volume homeostasis secondary to brain hyperammonemia. Recent data have shown that white matter abnormalities, also related to increased CNS ammonia concentration, can also be detected with several MR imaging techniques such as magnetization transfer ratio measurements, fast fluid-attenuated inversion recovery sequences, and diffusion-weighted images. All these MR imaging abnormalities, which return to normal with restoration of liver function, probably reflect the presence of mild diffuse brain edema, which seems to play an essential role in the pathogenesis of HE. It is likely that MR imaging will be increasingly used to evaluate the mechanisms involved in the pathogenesis of HE and to assess the effects of therapeutic measures focused on correcting brain edema in these patients.
Figures
References
-
- Cordoba J, Blei AT. Hepatic encephalopathy. In: Shiff ER, Sorrell MF, Maddrey WC, eds. Shiff's Diseases of the Liver. Philadelphia: Lippincott Williams & Wilkins;2003. :595–623
-
- Ferenci P, Lockwood A, Mullen K, et al. Hepatic encephalopathy: definition, nomenclature, diagnosis, and quantification—final report of the working party at the 11th World Congresses of Gastroenterology, Vienna, 1998. Hepatology 2002;35:716–21 - PubMed
-
- Weissenborn K. Diagnosis of encephalopathy. Digestion 1998;59 (suppl 2):22–24 - PubMed
-
- Cadranel JF, Lebiez E, Di Martino V, et al. Focal neurological signs in hepatic encephalopathy in cirrhotic patients: an underestimated entity? Am J Gastroenterol 2001;96:515–18 - PubMed
-
- Joebges EM, Heidemann M, Schimke N, et al. Bradykinesia in minimal hepatic encephalopathy is due to disturbances in movement initiation. J Hepatol 2003;38:273–80 - PubMed
Publication types
MeSH terms
Substances
LinkOut - more resources
Full Text Sources
Medical