

Initial interaction of apoA-I with ABCA1 impacts in vivo metabolic fate of nascent HDL
- PMID: 18583707
- PMCID: PMC2563212
- DOI: 10.1194/jlr.M800241-JLR200
Initial interaction of apoA-I with ABCA1 impacts in vivo metabolic fate of nascent HDL
Abstract
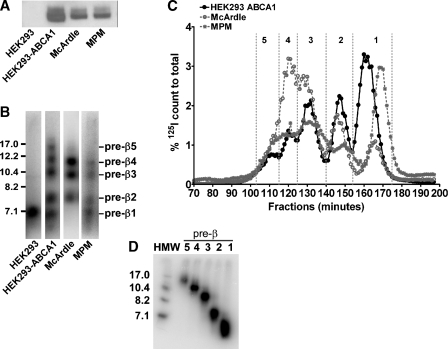
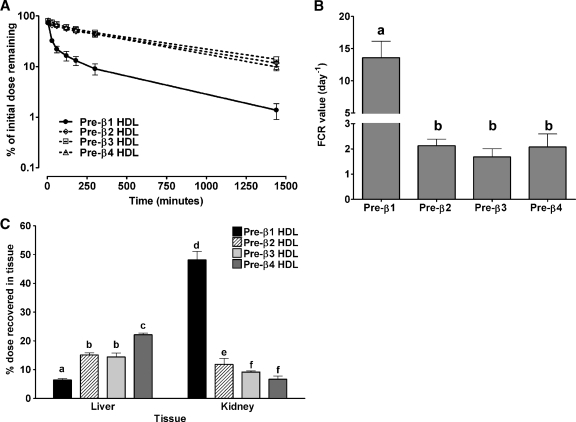
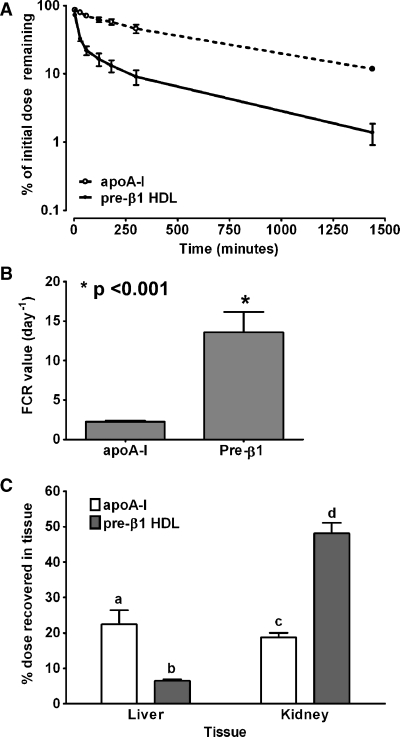
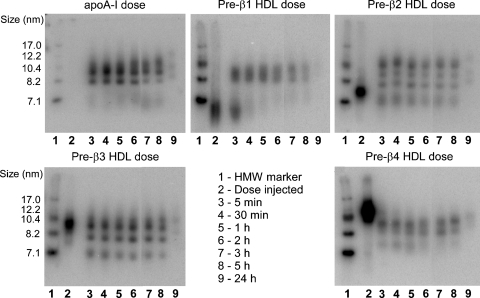
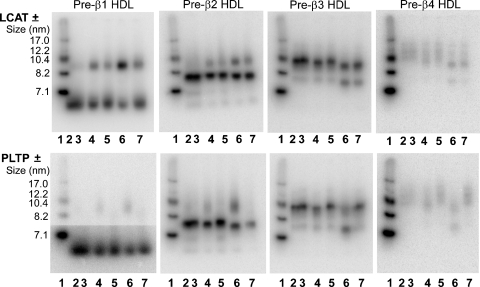
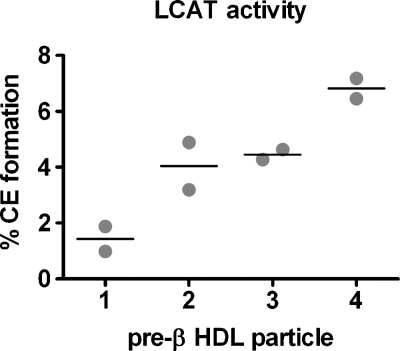
We investigated the in vivo metabolic fate of pre-beta HDL particles in human apolipoprotein A-I transgenic (hA-I (Tg)) mice. Pre-beta HDL tracers were assembled by incubation of [(125)I]tyramine cellobiose-labeled apolipoprotein A-I (apoA-I) with HEK293 cells expressing ABCA1. Radiolabeled pre-beta HDLs of increasing size (pre-beta1, -2, -3, and -4 HDLs) were isolated by fast-protein liquid chromatography and injected into hA-I (Tg)-recipient mice, after which plasma decay, in vivo remodeling, and tissue uptake were monitored. Pre-beta2, -3, and -4 had similar plasma die-away rates, whereas pre-beta1 HDL was removed 7-fold more rapidly. Radiolabel recovered in liver and kidney 24 h after tracer injection suggested increased (P < 0.001) liver and decreased kidney catabolism as pre-beta HDL size increased. In plasma, pre-beta1 and -2 were rapidly (<5 min) remodeled into larger HDLs, whereas pre-beta3 and -4 were remodeled into smaller HDLs. Pre-beta HDLs were similarly remodeled in vitro with control or LCAT-immunodepleted plasma, but not when incubated with phospholipid transfer protein knockout plasma. Our results suggest that initial interaction of apoA-I with ABCA1 imparts a unique conformation that partially determines the in vivo metabolic fate of apoA-I, resulting in increased liver and decreased kidney catabolism as pre-beta HDL particle size increases.
Figures
Similar articles
-
HDLs in apoA-I transgenic Abca1 knockout mice are remodeled normally in plasma but are hypercatabolized by the kidney.J Lipid Res. 2005 Oct;46(10):2233-45. doi: 10.1194/jlr.M500179-JLR200. Epub 2005 Jul 16. J Lipid Res. 2005. PMID: 16024913
-
Minimal lipidation of pre-beta HDL by ABCA1 results in reduced ability to interact with ABCA1.Arterioscler Thromb Vasc Biol. 2007 Aug;27(8):1828-36. doi: 10.1161/ATVBAHA.107.142455. Epub 2007 May 17. Arterioscler Thromb Vasc Biol. 2007. PMID: 17510466
-
Characterization and properties of pre beta-HDL particles formed by ABCA1-mediated cellular lipid efflux to apoA-I.J Lipid Res. 2008 May;49(5):1006-14. doi: 10.1194/jlr.M700506-JLR200. Epub 2008 Feb 5. J Lipid Res. 2008. PMID: 18252847 Free PMC article.
-
ATP-binding cassette transporter AI and its role in HDL formation.Curr Opin Lipidol. 2005 Feb;16(1):19-25. doi: 10.1097/00041433-200502000-00005. Curr Opin Lipidol. 2005. PMID: 15650559 Review.
-
The origin and metabolism of a nascent pre-β high density lipoprotein involved in cellular cholesterol efflux.Acta Biochim Pol. 2011;58(3):275-85. Epub 2011 Jul 12. Acta Biochim Pol. 2011. PMID: 21750785 Review.
Cited by
-
Effects of niacin and omega-3 fatty acids on HDL-apolipoprotein A-I exchange in subjects with metabolic syndrome.PLoS One. 2024 Feb 26;19(2):e0296052. doi: 10.1371/journal.pone.0296052. eCollection 2024. PLoS One. 2024. PMID: 38408107 Free PMC article. Clinical Trial.
-
Analysis of lipid transfer activity between model nascent HDL particles and plasma lipoproteins: implications for current concepts of nascent HDL maturation and genesis.J Lipid Res. 2010 Apr;51(4):785-97. doi: 10.1194/jlr.M001875. Epub 2009 Sep 29. J Lipid Res. 2010. PMID: 19797257 Free PMC article.
-
Effects of Disease-Causing Mutations on the Conformation of Human Apolipoprotein A-I in Model Lipoproteins.Biochemistry. 2018 Jul 31;57(30):4583-4596. doi: 10.1021/acs.biochem.8b00538. Epub 2018 Jul 13. Biochemistry. 2018. PMID: 30004693 Free PMC article.
-
Lipid biology of the podocyte--new perspectives offer new opportunities.Nat Rev Nephrol. 2014 Jul;10(7):379-88. doi: 10.1038/nrneph.2014.87. Epub 2014 May 27. Nat Rev Nephrol. 2014. PMID: 24861084 Free PMC article. Review.
-
Adipose tissue ATP binding cassette transporter A1 contributes to high-density lipoprotein biogenesis in vivo.Circulation. 2011 Oct 11;124(15):1663-72. doi: 10.1161/CIRCULATIONAHA.111.025445. Epub 2011 Sep 19. Circulation. 2011. PMID: 21931081 Free PMC article.
References
-
- Atkinson D., and D. M. Small. 1986. Recombinant lipoproteins: implications for structure and assembly of native lipoproteins. Annu. Rev. Biophys. Biophys. Chem. 15 403–456. - PubMed
-
- Eisenberg S. 1984. High density lipoprotein metabolism. J. Lipid Res. 25 1017–1058. - PubMed
-
- Gordon D. J., J. L. Probstfield, R. J. Garrison, J. D. Neaton, W. P. Castelli, J. D. Knoke, D. R. Jacobs, Jr., S. Bangdiwala, and H. A. Tyroler. 1989. High-density lipoprotein cholesterol and cardiovascular disease. Four prospective American studies. Circulation. 79 8–15. - PubMed
-
- Fielding C. J., and P. E. Fielding. 1995. Molecular physiology of reverse cholesterol transport. J. Lipid Res. 36 211–228. - PubMed
-
- Nofer J. R., B. Kehrel, M. Fobker, B. Levkau, G. Assmann, and A. von Eckardstein. 2002. HDL and arteriosclerosis: beyond reverse cholesterol transport. Atherosclerosis. 161 1–16. - PubMed
Publication types
MeSH terms
Substances
Grants and funding
LinkOut - more resources
Full Text Sources
Molecular Biology Databases
Miscellaneous
