. 2008 Jun 15;7(12):1782-7.
doi: 10.4161/cc.7.12.6067. Epub 2008 Jun 2.

Coordination of mitochondrial bioenergetics with G1 phase cell cycle progression

Affiliations

Coordination of mitochondrial bioenergetics with G1 phase cell cycle progression

Stefan M Schieke et al. Cell Cycle. .

Abstract

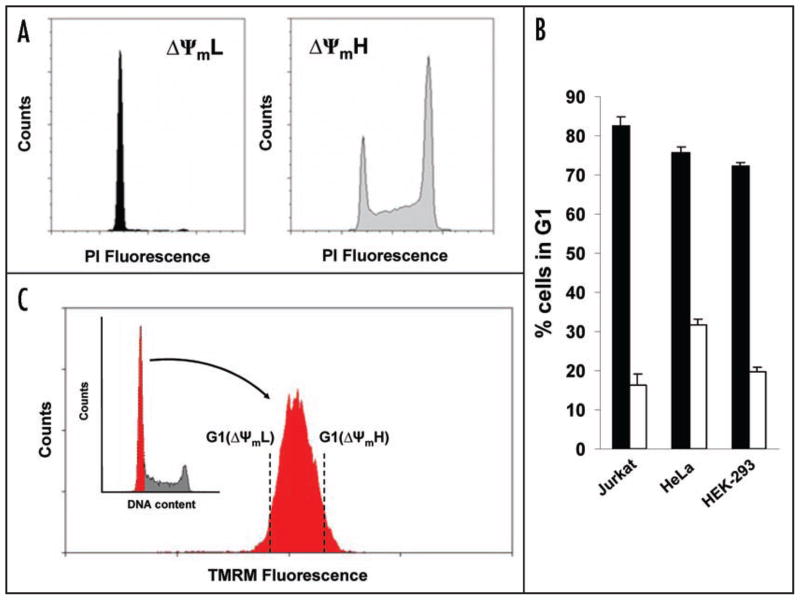
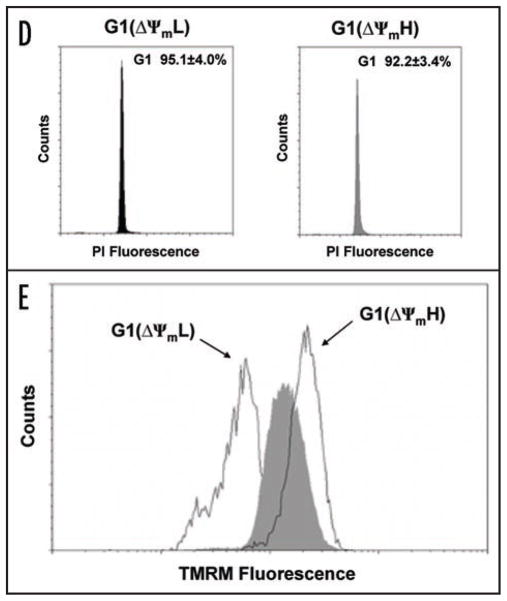
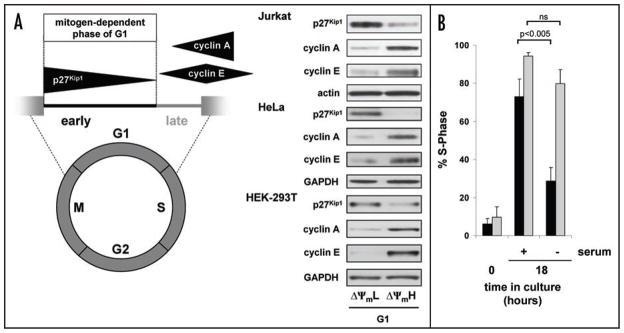
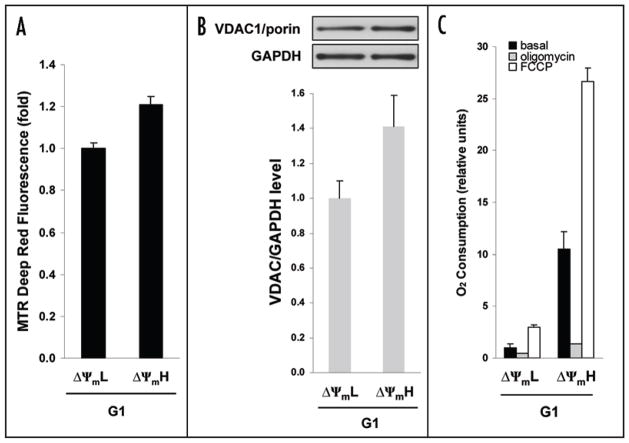
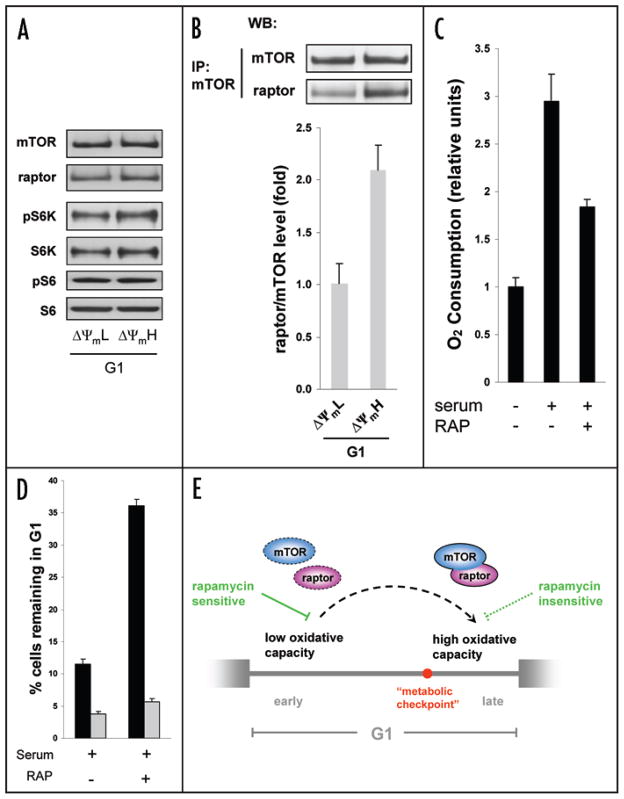
Relatively little is known regarding how energetic demand during cell proliferation is sensed or coordinated with mitochondrial metabolism. Here we demonstrate that cell cycle progression through G(1) is associated with a significant increase in mitochondrial membrane potential (DeltaPsi(m)) and respiration. We used this change in metabolic rate to isolate cells in G(1) with low and high levels of mitochondrial membrane potential (DeltaPsi(m)L and DeltaPsi(m)H). Biochemical and functional studies demonstrate that DeltaPsi(m)L and DeltaPsi(m)H cells display the distinct characteristics of early and late G(1) phase, respectively. We further demonstrate that the metabolic rate in G(1) reflects levels of the mTOR-raptor complex as well as susceptibility to rapamycin-induced cell cycle delay. In conclusion, our data suggests a coupling of mitochondrial bioenergetics and G(1) progression and points to the mTOR signaling pathway as a potential molecular coordinator of these two processes.


Figures

Figure 1
Figure 1
Variation of mitochondrial membrane potential during cell cycle progression. (A) Cell cycle distribution as assessed by propidium iodide (PI) fluorescence of Jurkat cells sorted initially for low (ΔΨmL) or high (ΔΨmH) mitochondrial membrane potential using TMRM. (B) Exponentially growing cultures from three different established cell lines were sorted based on TMRM fluorescence. Shown is the percentage of the sorted ΔΨmL (shaded bars) or ΔΨmH (open bars) cells that were in the G1 phase. (C) Sorting strategy for G1 cells with low and high ΔΨm. G1 purified cells denoted in red, were subsequently analyzed for mitochondrial membrane potential as assessed by TMRM fluorescence. (D) Cell cycle analysis of G1 cells sorted for low and high ΔΨm with quantitative post-sort purity derived from four independent experiments (mean ± SD). (E) Post-sort analysis of ΔΨm of G1 cells sorted for low and high membrane potential compared to unsorted G1 cells (shaded area).
Figure 1
Figure 1
Variation of mitochondrial membrane potential during cell cycle progression. (A) Cell cycle distribution as assessed by propidium iodide (PI) fluorescence of Jurkat cells sorted initially for low (ΔΨmL) or high (ΔΨmH) mitochondrial membrane potential using TMRM. (B) Exponentially growing cultures from three different established cell lines were sorted based on TMRM fluorescence. Shown is the percentage of the sorted ΔΨmL (shaded bars) or ΔΨmH (open bars) cells that were in the G1 phase. (C) Sorting strategy for G1 cells with low and high ΔΨm. G1 purified cells denoted in red, were subsequently analyzed for mitochondrial membrane potential as assessed by TMRM fluorescence. (D) Cell cycle analysis of G1 cells sorted for low and high ΔΨm with quantitative post-sort purity derived from four independent experiments (mean ± SD). (E) Post-sort analysis of ΔΨm of G1 cells sorted for low and high membrane potential compared to unsorted G1 cells (shaded area).
Figure 2
Figure 2
G1 cells with low and high ΔΨm correspond to early and late G1 phase. (A) Schematic representation of G1 progression with corresponding Western blot analysis of G1 cells sorted for low and high ΔΨm in either Jurkat T cells, HeLa cells or HEK-293T cells. (B) Mitochondrial membrane potential and the G1 restriction point. S-phase entry of G1 cells with low (black bars) or high (grey bars) ΔΨm immediately after sorting (time 0) or after being maintained in serum-free conditions for 18 hours or after a similar time following serum stimulation. Results are from three independent experiments (mean ± SD).
Figure 3
Figure 3
Oxygen consumption and oxidative capacity during G1 progression. (A) Mitochondrial mass determination from an equal number of cells using Mitotracker (MTR) Deep Red fluorescence (relative scale) of G1 cells sorted for low (ΔΨmL) or high (ΔΨmH) mitochondrial membrane potential using TMRM fluorescence (mean ± SD, n = 3). (B) Expression level of the mitochondrial protein VDAC1/porin detected from equal amount of protein lysate of G1 cells sorted for low (ΔΨmL) or high (ΔΨmH) mitochondrial membrane potential. A representative Western blot is shown as is the quantification from three separate experiments. (C) Corresponding levels of oxygen consumption under basal growth conditions (black bars), in the presence of oligomycin (respiratory leak, grey bars), and FCCP (maximal oxidative capacity, open bars). Data represents means ± SD from three independent experiments.
Figure 4
Figure 4
mTOR-raptor complex formation during G1 progression. (A) Western blot analysis of G1 cells sorted by mitochondrial membrane potential demonstrates no significant change in absolute levels of mTOR, raptor, or the activation by phosphorylation of S6K. (B) Formation of mTOR-raptor complexes increases from early to late G1. Equal amounts of protein lysate were immunoprecipitated (IP) for mTOR and the amount of coprecipitated raptor assessed by Western blotting (WB). Quantifica- ion is from three separate experiments. (C) Determination of oxygen consumption in cells isolated so as to be in early G1 (ΔΨmL). Oxygen consumption was measured for cells that were maintained in serum free conditions or for an equal number of cells stimulated for 18 hours with serum in the presence or absence of rapamycin. (D) Mitochondrial membrane potential determines the efficacy of rapamycin-induced G1 delay. Cell cycle analysis of G1 cells sorted for either high or low membrane potential. Cells still remaining in G1 were determined as percentage of BrdU-negative cells 18 hours after serum stimulation in the presence or absence of rapamycin (mean ± SD, n = 3). (E) Model of the G1 phase. The concerted rise of mitochondrial oxidative capacity and formation of mTOR-raptor complex during G1 progression may play a role for the passage of a putative metabolic checkpoint between early and late G1.

References

    1. Mandal S, Guptan P, Owusu-Ansah E, Banerjee U. Mitochondrial regulation of cell cycle progression during development as revealed by the tenured mutation in Drosophila. Dev Cell. 2005;9:843–54. - PubMed
    1. Holley RW, Kiernan JA. Control of the initiation of DNA synthesis in 3T3 cells: low-molecular weight nutrients. Proc Natl Acad Sci USA. 1974;71:2942–5. - PMC - PubMed
    1. Graeber TG, Peterson JF, Tsai M, Monica K, Fornace AJ, Jr, Giaccia AJ. Hypoxia induces accumulation of p53 protein, but activation of a G1-phase checkpoint by low-oxygen conditions is independent of p53 status. Mol Cell Biol. 1994;14:6264–77. - PMC - PubMed
    1. Jones RG, Plas DR, Kubek S, Buzzai M, Mu J, Xu Y, Birnbaum MJ, Thompson CB. AMP-activated protein kinase induces a p53-dependent metabolic checkpoint. Mol Cell. 2005;18:283–93. - PubMed
    1. Pardee AB. A restriction point for control of normal animal cell proliferation. Proc Natl Acad Sci USA. 1974;71:1286–90. - PMC - PubMed