Comparative Study
. 2008 Jun 27;4(6):e1000116.
doi: 10.1371/journal.pgen.1000116.

Global mapping of DNA methylation in mouse promoters reveals epigenetic reprogramming of pluripotency genes

Affiliations
Comparative Study

Global mapping of DNA methylation in mouse promoters reveals epigenetic reprogramming of pluripotency genes

Cassandra R Farthing et al. PLoS Genet. .

Abstract

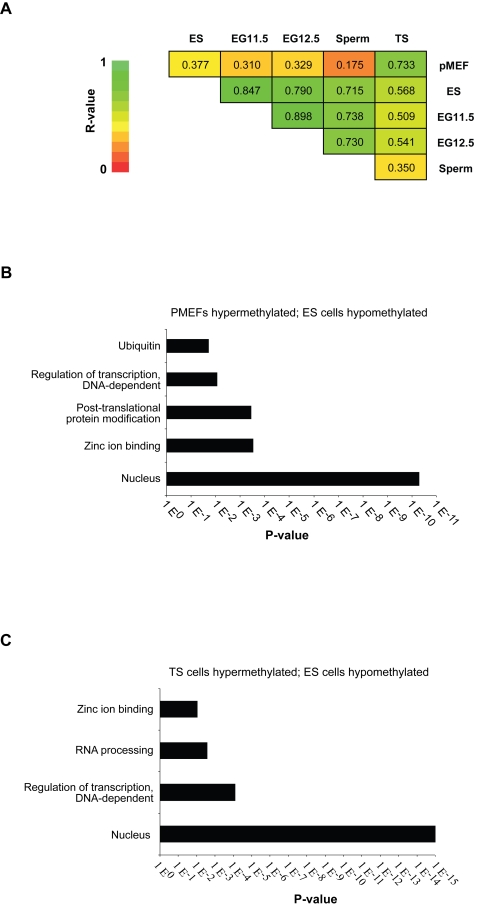
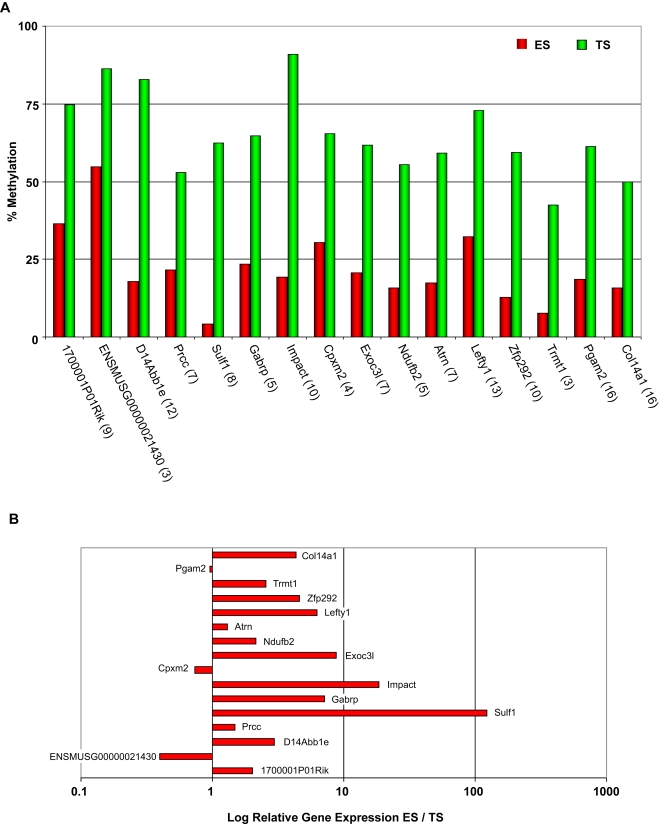
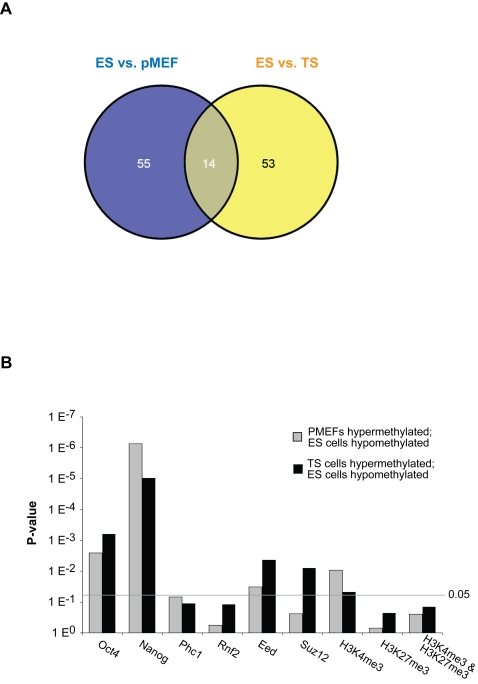
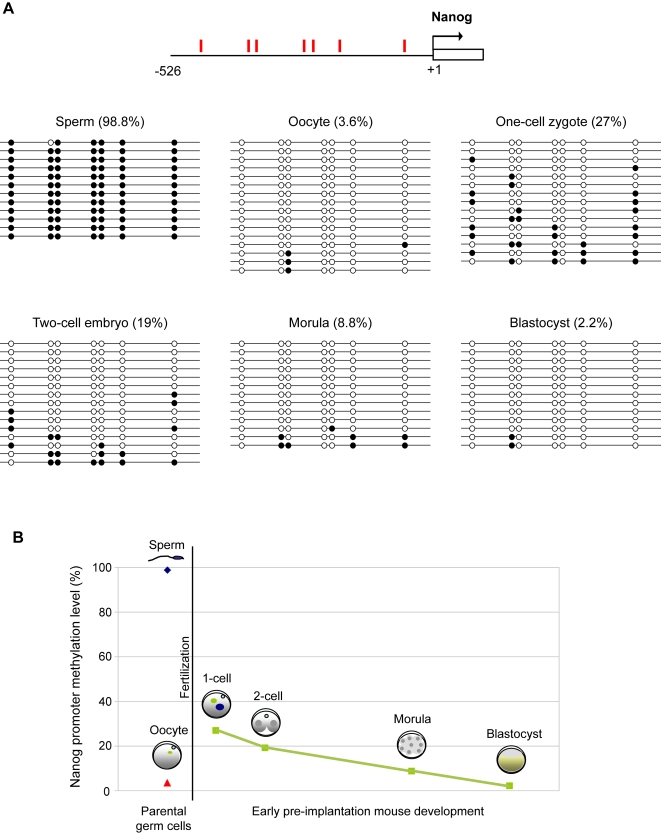
DNA methylation patterns are reprogrammed in primordial germ cells and in preimplantation embryos by demethylation and subsequent de novo methylation. It has been suggested that epigenetic reprogramming may be necessary for the embryonic genome to return to a pluripotent state. We have carried out a genome-wide promoter analysis of DNA methylation in mouse embryonic stem (ES) cells, embryonic germ (EG) cells, sperm, trophoblast stem (TS) cells, and primary embryonic fibroblasts (pMEFs). Global clustering analysis shows that methylation patterns of ES cells, EG cells, and sperm are surprisingly similar, suggesting that while the sperm is a highly specialized cell type, its promoter epigenome is already largely reprogrammed and resembles a pluripotent state. Comparisons between pluripotent tissues and pMEFs reveal that a number of pluripotency related genes, including Nanog, Lefty1 and Tdgf1, as well as the nucleosome remodeller Smarcd1, are hypomethylated in stem cells and hypermethylated in differentiated cells. Differences in promoter methylation are associated with significant differences in transcription levels in more than 60% of genes analysed. Our comparative approach to promoter methylation thus identifies gene candidates for the regulation of pluripotency and epigenetic reprogramming. While the sperm genome is, overall, similarly methylated to that of ES and EG cells, there are some key exceptions, including Nanog and Lefty1, that are highly methylated in sperm. Nanog promoter methylation is erased by active and passive demethylation after fertilisation before expression commences in the morula. In ES cells the normally active Nanog promoter is silenced when targeted by de novo methylation. Our study suggests that reprogramming of promoter methylation is one of the key determinants of the epigenetic regulation of pluripotency genes. Epigenetic reprogramming in the germline prior to fertilisation and the reprogramming of key pluripotency genes in the early embryo is thus crucial for transmission of pluripotency.


Conflict of interest statement

The authors have declared that no competing interests exist.

Figures

Figure 1
Figure 1. Global relationship between meDIP signal and CpG content.
(A) Scatter plot of meDIP methylation signal (Log2 ratio) in all promoters with varying CpG content (example shown is from an ES cell sample and is representative of the pattern observed in all cell types analysed). There is an initial rise in signal up to 5% CpG content, followed by a sudden drop in signal for promoters with above 5% CpG content. (B) Promoters with more than 9% CpG content were mostly unmethylated in different cell types, as revealed by Sequenom analysis. Four examples are shown whose methylation was compared between ES and TS cells.
Figure 2
Figure 2. Global comparisons of promoter methylation patterns between cell types.
(A) Pairwise correlation comparisons were made between all cell types to establish the similarity of promoter methylation. R-values were compared for significant correlation both within and between groups, and are represented by a colour-coded scale (green is highly correlated). (B) Gene Ontology analysis for genes which are hypermethylated in pMEFs and hypomethylated in ES cells. GO terms with a significant enrichment (p<0.01) are shown. (C) Gene Ontology analysis for genes which are hypermethylated in TS cells and hypomethylated in ES cells. GO terms with a significant enrichment (p<0.01) are shown.
Figure 3
Figure 3. Promoter methylation and gene expression compared between ES cells and pMEFs.
(A) Promoter methylation patterns in ES cells (red bars), early passage pMEFs (pMEFs-P1, light blue bars), late passage pMEFs (pMEFs-P5, dark blue bars) and sperm (yellow bars). Candidate promoter regions were identified by the meDIP screen and validated by Sequenom analysis. The number of differentially methylated CpGs analysed for each gene are given in brackets. (B) Gene expression differences between ES cells and pMEFs (P1) as determined by quantitative RT-PCR analysis. The x-axis gives the log-fold expression difference between the cell types (i.e., log [ES/pMEF]). Three reference genes (Dynein, Rsp23 and Hdac10-11) were used for normalization between cell types.
Figure 4
Figure 4. Promoter methylation and gene expression compared between ES and TS cells.
(A) Promoter methylation patterns in ES cells (red bars) and TS cells (green bars). Candidate promoter regions were identified by the meDIP screen and validated by Sequenom analysis. The number of differentially methylated CpGs analysed for each gene are given in brackets. (B) Gene expression differences between ES and TS cells as determined by quantitative RT-PCR analysis. The x-axis gives the log-fold expression difference between the cell types (i.e., log [ES/TS]). Three reference genes (Dynein, Pmm1 and Sdha) were used for normalization.
Figure 5
Figure 5. Global comparisons between promoter methylation and chromatin signatures.
(A) Venn diagram showing the overlapping genes between ES cell versus pMEFs (blue) and ES cell versus TS cell (yellow) datasets. 14 genes were found in common and show hypermethylation in lineage committed and differentiated cell types. (B) Comparison of differentially methylated genes in the ES cell versus pMEFs or ES cell versus TS cell dataset with ChIP datasets of Nanog/Oct4- and PcG-binding sites ,, and histone H3K4/H3K27 methylation in ES cells. Correlations with p-values of <0.05 are regarded as significant. Genes analyzed were all hypomethylated in ES cells and hypermethylated in pMEFs or TS cells.
Figure 6
Figure 6. Epigenetic reprogramming of the Nanog promoter during preimplantation development.
(A) Methylation patterns of the Nanog promoter in gametes and in early fertilised embryos were determined by bisulphite sequencing analysis. The Nanog promoter is highly methylated in sperm but hypomethylated in fertilised embryos. CpG dinucleotides are represented as open circles (unmethylated) or closed circles (methylated). The percentage of CpG methylation is indicated in brackets. (B) Summary of Nanog promoter methylation during preimplantation mouse development. The level of methylation at the Nanog promoter is given as a percentage. Methylation levels are given for the gametes and at the preimplantation stages indicating that the Nanog promoter undergoes both active and passive demethylation after fertilisation.
Figure 7
Figure 7. Targeted DNA methylation of the Nanog promoter in ES cells silences gene expression.
A Nanog-GFP reporter plasmid with or without UAS targeting sequences was transfected into mouse ES cells together with a Gal4-Dnmt3a (wild-type or catalytic mutant) in addition to a pDsRed-C1 RFP construct as a transfection efficiency control. The number of GFP expressing cells (green bars), RFP expressing cells (red bars), and overlap between GFP and RFP expressing cells (yellow) was determined. Top row: transfection of Nanog-GFP without the UAS sequence together with Gal4-Dnmt3a results in high level (95.9%) GFP expression and 0% DNA methylation of the Nanog promoter (red box). Middle row: transfection of UAS-Nanog-GFP together with Gal4-Dnmt3a results in low level (14.5%) GFP expression and 40.9% promoter methylation. Bottom row: transfection of UAS-Nanog-GFP together with the catalytic mutant of Gal4-Dnmt3a results in high level (80.3%) GFP expression and 2.9% promoter methylation. Three independent transient transfection experiments were performed. P values (* indicates p<0.001) were calculated by Student's t-Test. The red box highlights the Nanog promoter region.

References

    1. Bird A. DNA methylation patterns and epigenetic memory. Genes Dev. 2002;16:6–21. - PubMed
    1. Li E. Chromatin modification and epigenetic reprogramming in mammalian development. Nat Rev Genet. 2002;3:662–673. - PubMed
    1. Reik W. Stability and flexibility of epigenetic gene regulation in mammalian development. Nature. 2007;447:425–432. - PubMed
    1. Schaefer CB, Ooi SKT, Bestor TH, Bourc'his D. Epigenetic Decisions in Mammalian Germ Cells. Science. 2007;316:398–399. - PubMed
    1. Reik W, Dean W, Walter J. Epigenetic reprogramming in mammalian development. Science. 2001;293:1089–1093. - PubMed

Publication types

MeSH terms