

The chemokine CCL2 activates p38 mitogen-activated protein kinase pathway in cultured rat hippocampal cells
- PMID: 18584881
- PMCID: PMC2583399
- DOI: 10.1016/j.jneuroim.2008.05.011
The chemokine CCL2 activates p38 mitogen-activated protein kinase pathway in cultured rat hippocampal cells
Abstract
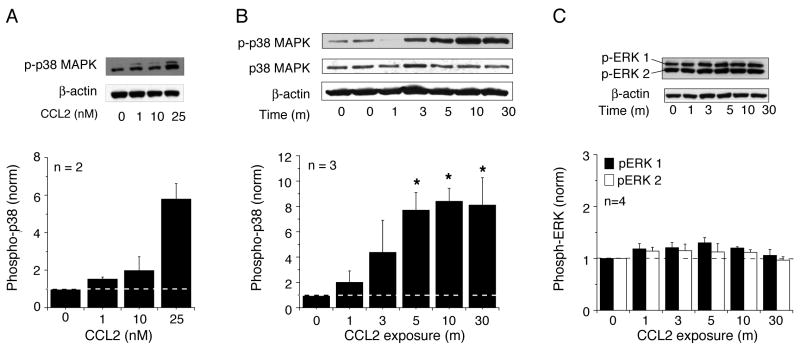
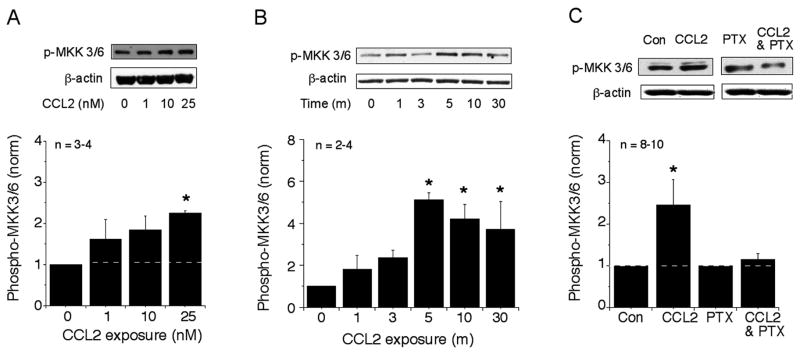
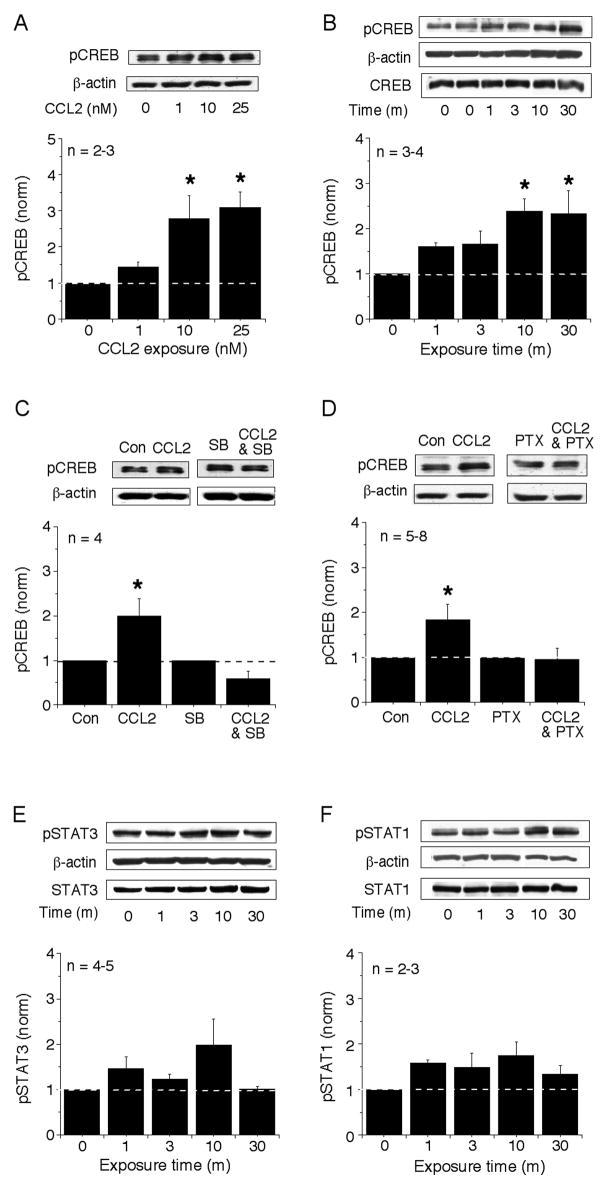
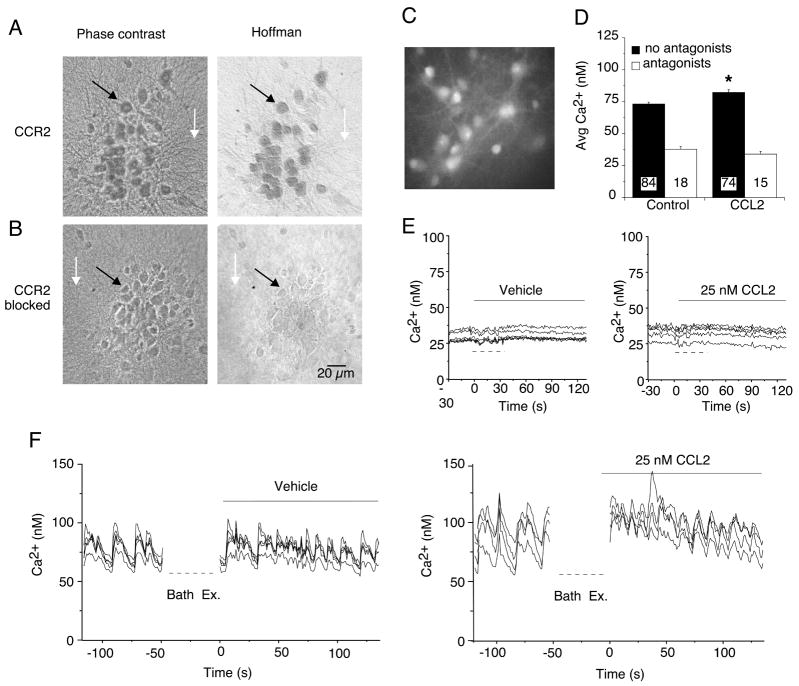
Emerging evidence indicates that chemokines can regulate both the physiology and biochemistry of CNS neurons and glia. In the current study, Western blot analysis showed that in rat hippocampal neuronal/glial cultures the signal transduction pathway activated by CCL2, a chemokine expressed in the normal brain and at elevated levels during neuroinflammation, involves a G-protein coupled receptor, p38 MAPK as well as its immediate upstream kinase MKK3/6, and the downstream transcription factor CREB. ERK 1/2 and the transcription factors STAT1 and STAT3 do not play a prominent role. CCL2 also altered Ca(2+) influx and synaptic network activity in the hippocampal neurons. These results suggest an important role for p38 MAPK and CREB in hippocampal actions of CCL2.
Figures
Similar articles
-
Dihydrotestosterone activates CREB signaling in cultured hippocampal neurons.Brain Res. 2009 Nov 17;1298:1-12. doi: 10.1016/j.brainres.2009.08.066. Epub 2009 Aug 31. Brain Res. 2009. PMID: 19729001 Free PMC article.
-
Cell type-specific interleukin-1beta signaling in the CNS.J Neurosci. 2004 Jul 21;24(29):6482-8. doi: 10.1523/JNEUROSCI.5712-03.2004. J Neurosci. 2004. PMID: 15269258 Free PMC article.
-
Excitatory actions of GABA increase BDNF expression via a MAPK-CREB-dependent mechanism--a positive feedback circuit in developing neurons.J Neurophysiol. 2002 Aug;88(2):1005-15. doi: 10.1152/jn.2002.88.2.1005. J Neurophysiol. 2002. PMID: 12163549
-
A calcium/calmodulin kinase pathway connects brain-derived neurotrophic factor to the cyclic AMP-responsive transcription factor in the rat hippocampus.Neuroscience. 2003;118(2):477-90. doi: 10.1016/s0306-4522(02)00963-6. Neuroscience. 2003. PMID: 12699783
-
17Beta-estradiol induced Ca2+ influx via L-type calcium channels activates the Src/ERK/cyclic-AMP response element binding protein signal pathway and BCL-2 expression in rat hippocampal neurons: a potential initiation mechanism for estrogen-induced neuroprotection.Neuroscience. 2005;135(1):59-72. doi: 10.1016/j.neuroscience.2004.12.027. Neuroscience. 2005. PMID: 16084662
Cited by
-
Role of CCL2/CCR2 axis in the pathogenesis of COVID-19 and possible Treatments: All options on the Table.Int Immunopharmacol. 2022 Dec;113(Pt A):109325. doi: 10.1016/j.intimp.2022.109325. Epub 2022 Oct 14. Int Immunopharmacol. 2022. PMID: 36252475 Free PMC article. Review.
-
Inhibition of Oxidative Neurotoxicity and Scopolamine-Induced Memory Impairment by γ-Mangostin: In Vitro and In Vivo Evidence.Oxid Med Cell Longev. 2019 Mar 24;2019:3640753. doi: 10.1155/2019/3640753. eCollection 2019. Oxid Med Cell Longev. 2019. PMID: 31019651 Free PMC article.
-
Synaptic plasticity in the hippocampus shows resistance to acute ethanol exposure in transgenic mice with astrocyte-targeted enhanced CCL2 expression.Neuropharmacology. 2013 Apr;67:115-25. doi: 10.1016/j.neuropharm.2012.11.007. Epub 2012 Nov 16. Neuropharmacology. 2013. PMID: 23164616 Free PMC article.
-
Novel Therapeutic Targets in Neuroinflammation and Neuropathic Pain.Inflamm Cell Signal. 2014;1(3):e111. doi: 10.14800/ics.111. Inflamm Cell Signal. 2014. PMID: 26052540 Free PMC article.
-
Persistent adaptation by chronic alcohol is facilitated by neuroimmune activation linked to stress and CRF.Alcohol. 2016 May;52:9-23. doi: 10.1016/j.alcohol.2016.01.005. Epub 2016 Feb 24. Alcohol. 2016. PMID: 27139233 Free PMC article. Review.
References
-
- Alonso M, Bevilaqua LR, Izquierdo I, Medina JH, Cammarota M. Memory formation requires p38MAPK activity in the rat hippocampus. Neuroreport. 2003;14:1989–1992. - PubMed
-
- Ambrosini E, Aloisi F. Chemokines and glial cells: a complex network in the central nervous system. Neurochem Res. 2004;29:1017–1038. - PubMed
-
- Andjelkovic AV, Song L, Dzenko KA, Cong H, Pachter JS. Functional expression of CCR2 by human fetal astrocytes. J Neurosci Res. 2002;70:219–231. - PubMed
-
- Bajetto A, Bonavia R, Barbero S, Schettini G. Characterization of chemokines and their receptors in the central nervous system: physiopathological implications. J Neurochem. 2002;82:1311–1329. - PubMed
Publication types
MeSH terms
Substances
Grants and funding
LinkOut - more resources
Full Text Sources
Other Literature Sources
Molecular Biology Databases
Research Materials
Miscellaneous
