Comparative Study
. 2008 Aug;38(4):595-606.
doi: 10.1016/j.mcn.2008.05.008. Epub 2008 May 20.

Ascl1 (Mash1) lineage cells contribute to discrete cell populations in CNS architecture

Affiliations
Comparative Study

Ascl1 (Mash1) lineage cells contribute to discrete cell populations in CNS architecture

Euiseok J Kim et al. Mol Cell Neurosci. 2008 Aug.

Abstract

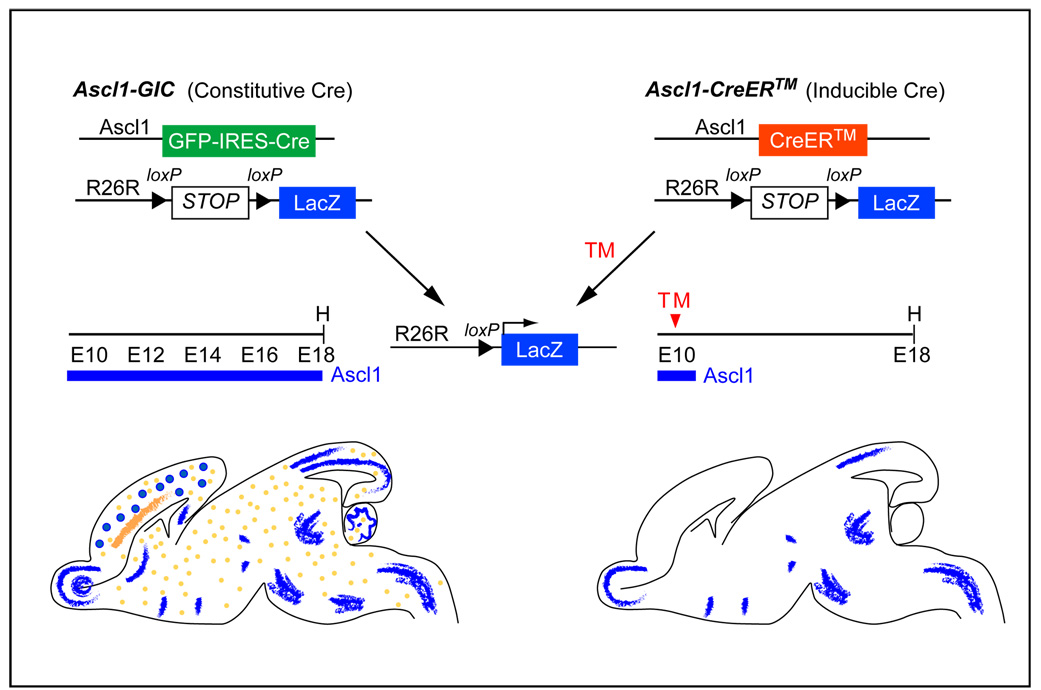
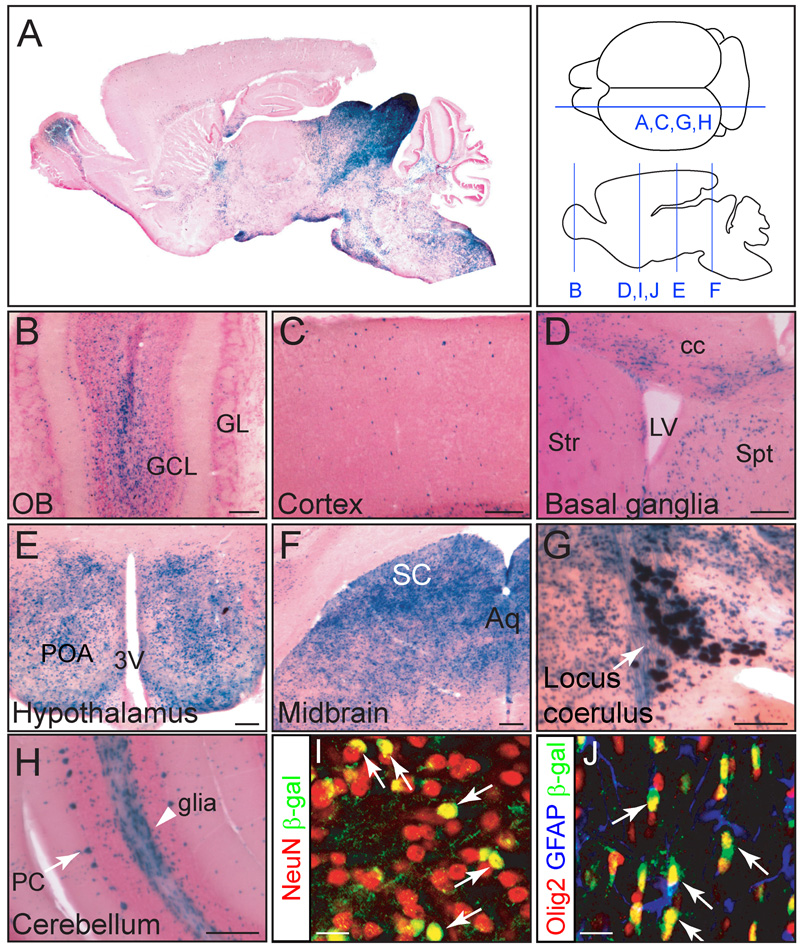
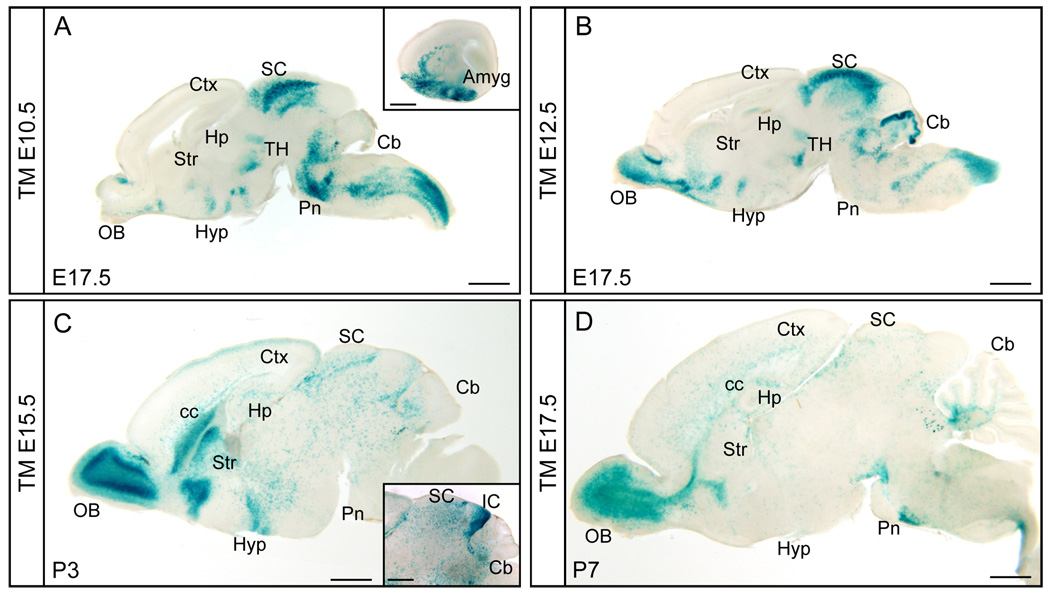
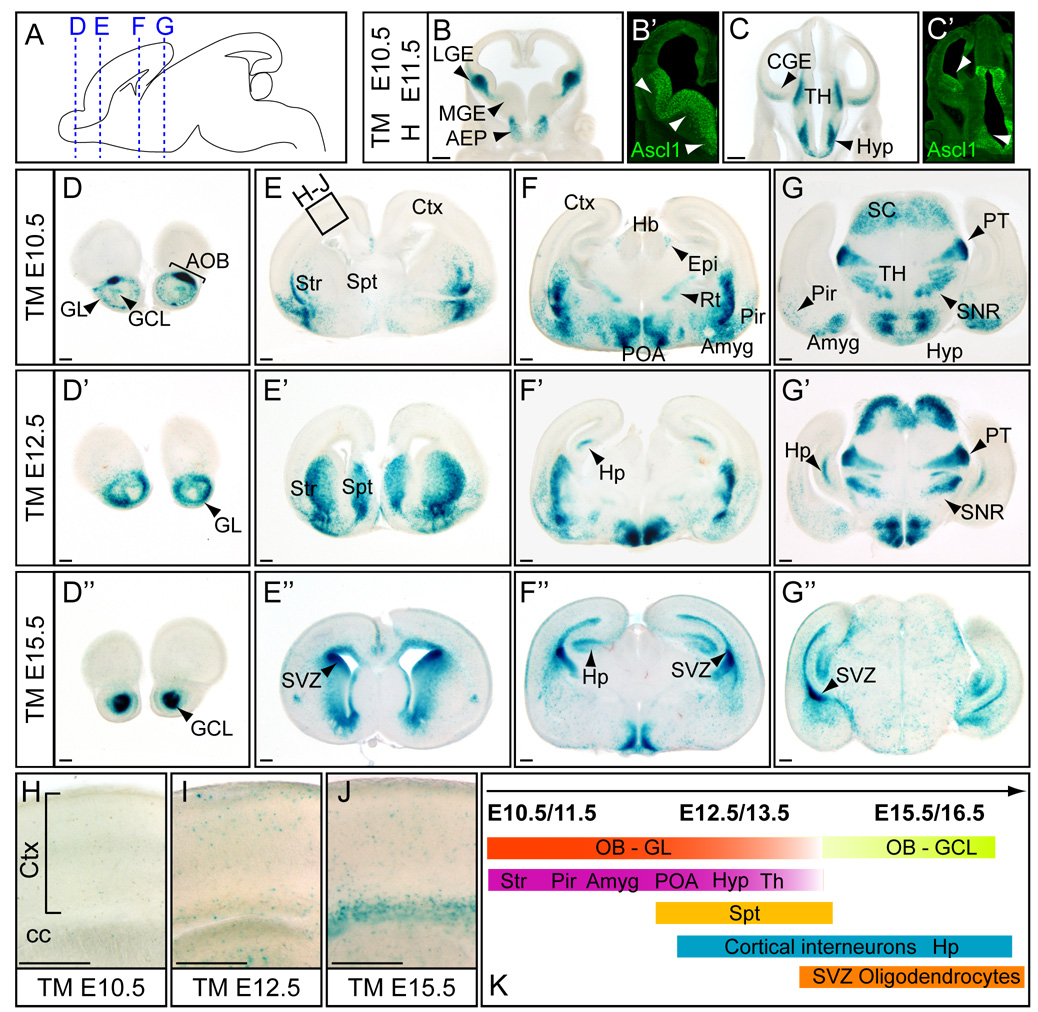
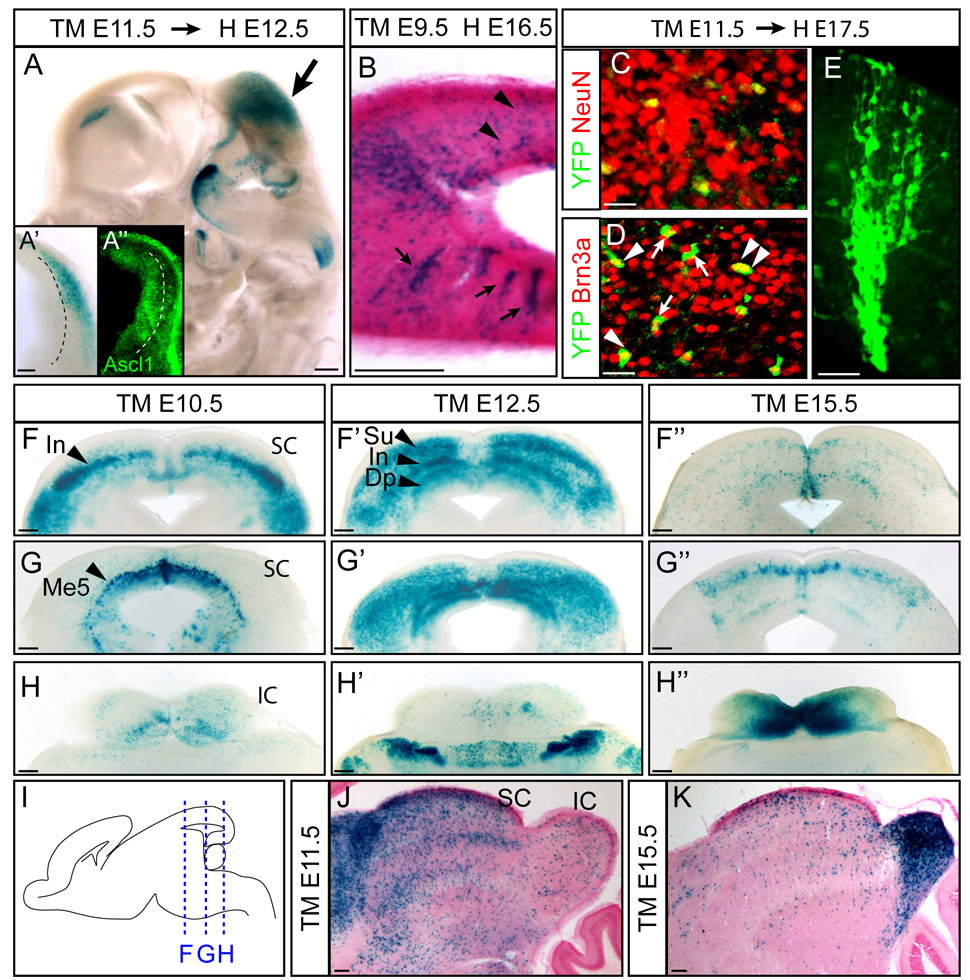
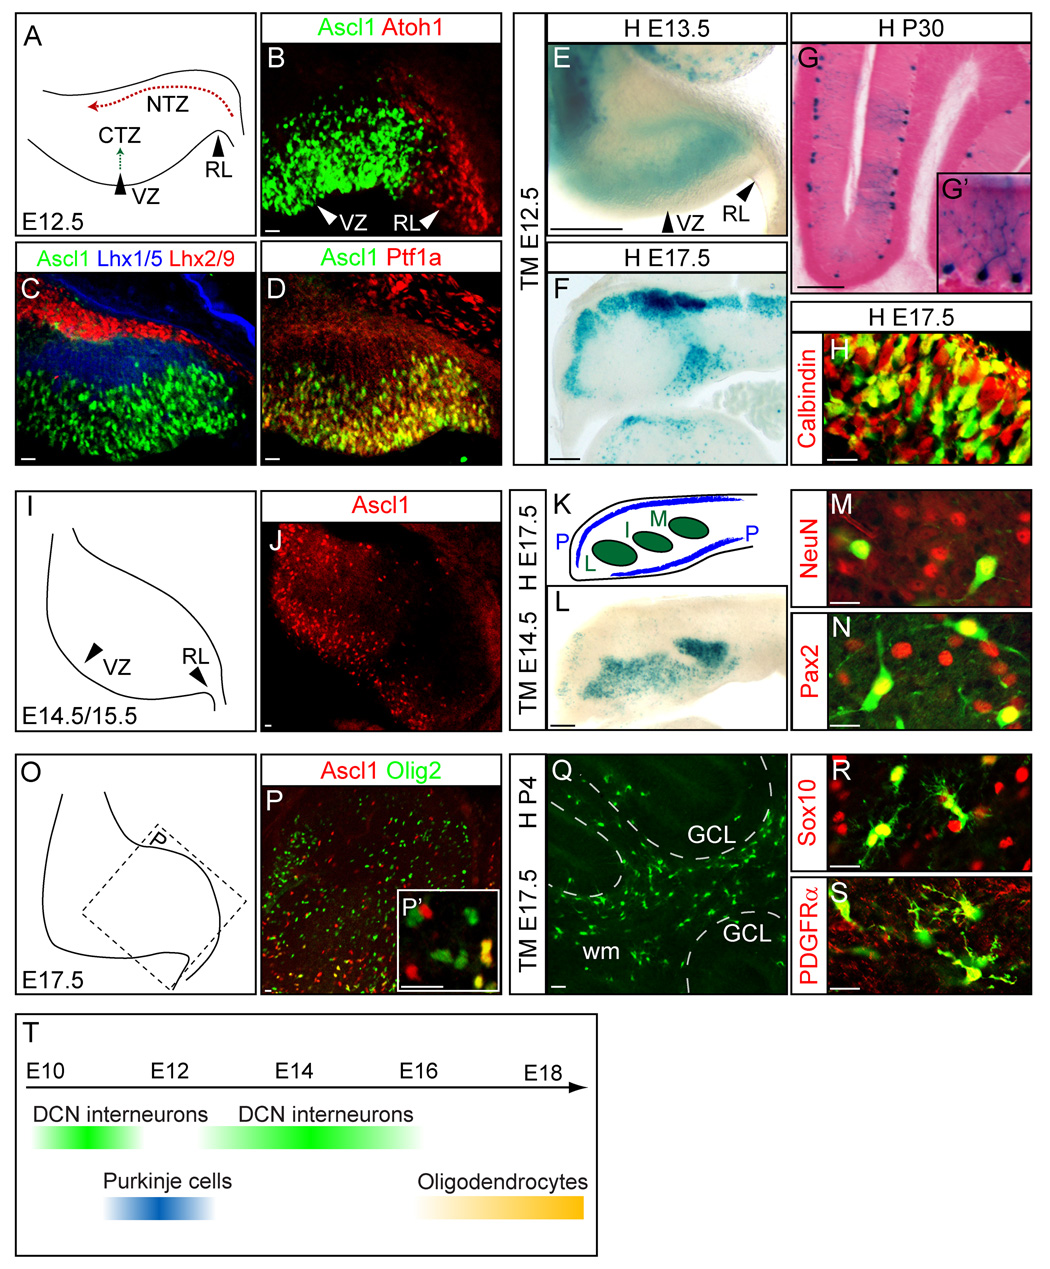
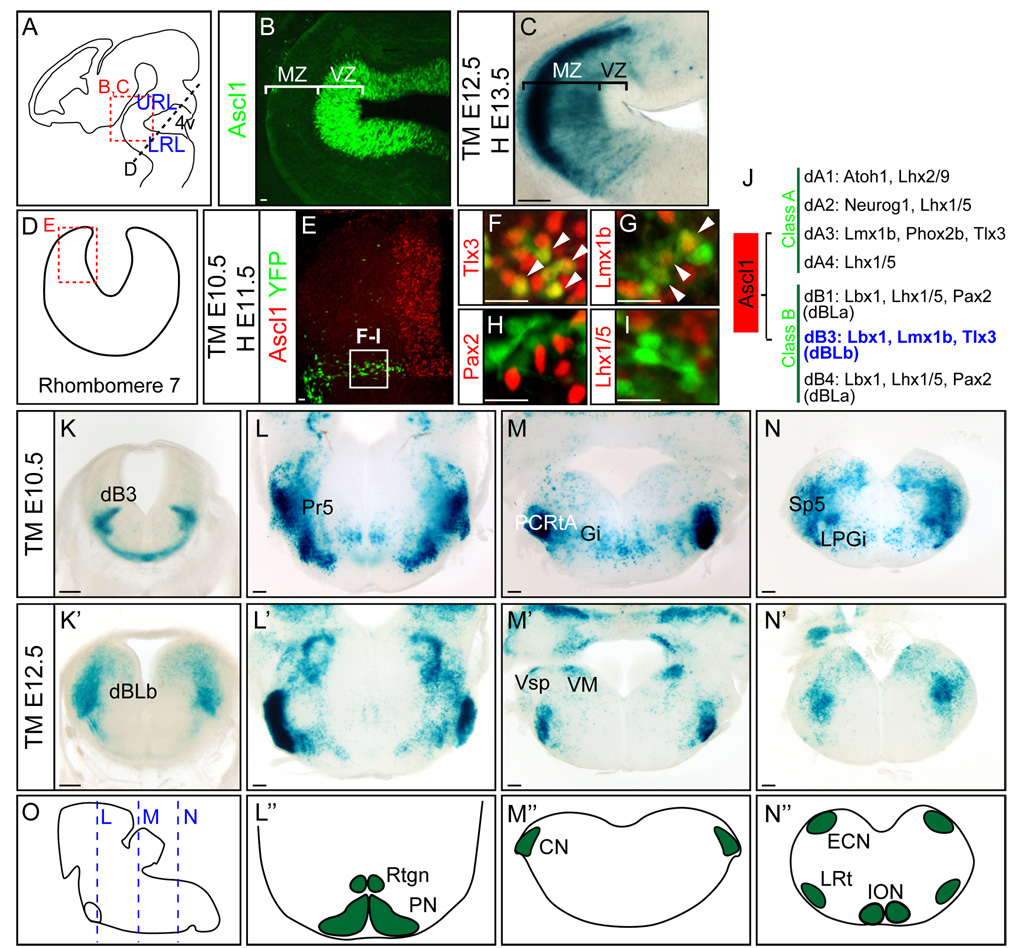
Ascl1 (previously Mash1) is a bHLH transcription factor essential for neuronal differentiation and specification in the nervous system. Although it has been studied for its role in several neural lineages, the full complement of lineages arising from Ascl1 progenitor cells remains unknown. Using an inducible Cre-flox genetic fate-mapping strategy, Ascl1 lineages were determined throughout the brain. Ascl1 is present in proliferating progenitor cells but these cells are actively differentiating as evidenced by rapid migration out of germinal zones. Ascl1 lineage cells contribute to distinct cell types in each major brain division: the forebrain including the cerebral cortex, olfactory bulb, hippocampus, striatum, hypothalamus, and thalamic nuclei, the midbrain including superior and inferior colliculi, and the hindbrain including Purkinje and deep cerebellar nuclei cells and cells in the trigeminal sensory system. Ascl1 progenitor cells at early stages in each CNS region preferentially become neurons, and at late stages they become oligodendrocytes. In conclusion, Ascl1-expressing progenitor cells in the brain give rise to multiple, but not all, neuronal subtypes and oligodendrocytes depending on the temporal and spatial context, consistent with a broad role in neural differentiation with some subtype specification.


Figures

Figure 1
Figure 1. Diagram of Ascl1 transgenic mice and the fate-mapping strategy
Two transgenic mouse models were generated with a BAC containing Ascl1 >200 kb flanking non-coding sequence. Ascl1-GIC replaces the Ascl1 coding sequence with GFP-IRES-Cre (Helms et al., 2005). This strain will reveal an accumulation of Ascl1 lineage cells when crossed with a Cre reporter mouse strain such as R26R-stop-lacZ (Soriano, 1999). Ascl1-CreER™ replaces the Ascl1 coding sequence with an inducible Cre (Battiste et al., 2007). Only Ascl1 lineage cells originating at the time of tamoxifen (TM) treatment will be detected when crossed with R26R-stop-lacZ. Sagittal views of mouse brains from each paradigm are diagrammed to highlight that the inducible Cre will reveal only a subset of the Ascl1 lineage. Blue represents neurons and orange represents oligodendrocytes E, embryonic stage; H, harvest age.
Figure 2
Figure 2. Ascl1-expressing cells give rise to discrete cell populations in brain
(A–H) X-gal staining of P30 brains from Ascl1-GIC;R26R-stop-lacZ transgenic mice including (A) whole brain, (B) olfactory bulb, (C) cerebral cortex, (D) striatum, (E) preoptic area of the hypothalamus, (F) dorsal midbrain, (G) locus coerulus, and (H) cerebellum. (I, J) Immunofluorescence for β-galactosidase in the striatum (I) or the anterior commissure (J). β-gal cells co-express neuronal marker NeuN (I, arrows) or the oligodendrocyte marker Olig2 (J, arrows, but not astrocytes (GFAP). Diagram depicts sectioning plane for each panel. 3V, third ventricle; Aq, aquaduct; cc, corpus callosum; GCL, granule cell layer; GL, glomerular layer; LV, lateral ventricle; OB, olfactory bulb; PC, Purkinje cells; POA, preoptic area; SC, superior colliculus; Spt, septum; Str, striatum. Scale bars = 200µm.
Figure 3
Figure 3. Temporal specific fate maps of the Ascl1 lineage in brain
Sagittal views of X-gal staining of Ascl1-CreER™;R26R-stop-lacZ brains at indicated stages treated with tamoxifen (TM) at embryonic stages indicated. Insets in A and C show amygdala and superior/inferior colliculus from different parasagittal axis sections respectively. Amyg, amygdala; Cb, cerebellum; cc, corpus callosum; Ctx, cortex; Hp, hippocampus; Hyp, hypothalamus; IC, inferior colliculus; OB, olfactory bulb; Pn, Pons; SC, superior colliculus; Str, striatum; TH, thalamus. Scale bars= 1000µm.
Figure 4
Figure 4. Ascl1 lineage in the forebrain
(A) Schematic of an E18.5 sagittal brain where dotted lines indicate coronal planes used for panels D–G”. (B–C) X-gal stained coronal sections of telencephalon in Ascl1-CreER™;R26R-stop-lacZ embryos treated at E10.5 and harvested 24 hr later at E11.5 showing the cells of origin marked by Ascl1-CreER™ compared to the endogenous expression patterns of Ascl1 (B’,C’). Ascl1-CreER™;R26R-stop-lacZ embryos exposed to tamoxifen at E10.5 (D–G), E11.5 (D’–G’), and E15.5 (D”–G”) and harvested at E18.5. (D-D”) (H–J) Magnified views (see box in E) to show Ascl1 lineage cells in the cortex and the corpus callosum after E12.5. (K) Summary of the temporal specific generation of discrete Ascl1 lineage cells in forebrain. AEP, anterior entopeduncular area; AOB, accessory olfactory bulb; Amyg, amygdala; cc, corpus callosum; CGE, caudal ganglionic eminence; Ctx, cortex; Epi, epithalamus; GCL, granule cell layer; GL, glomerular layer; Hb, habernula; Hyp, hypothalamus; LGE, lateral ganglionic eminence; MGE, medial ganglionic eminence; Pir, piriform cortex; POA, preoptic area; PT, pretectal nucleus; Rt, reticular thalamic nucleus; Sc, superior colliculus; SNR, subtrantia nigra (reticular part); Spt, septum; Str, striatum; SVZ, subventricular zone; TH, thalamus. Scale bars = 300µm.
Figure 5
Figure 5. Ascl1 lineage in the dorsal midbrain
(A) β-gal expression in dorsal mesencephalon (arrow) of Ascl1-CreER™;R26R-stop-lacZ embryos tamoxifen-induced (TM) at E11.5 and harvested (H) at E12.5. Higher magnification of a coronal view shows β-gal present in cells adjacent to the ventricular zone (A’). In contrast, endogenous Ascl1 expression is restricted to the ventricular zone (A”). (B) Ascl1 lineage cells show both scattered (arrowheads) and radially (arrows) arrayed expression patterns. (C–E) In Ascl1-CreER™;R26R-stop-YFP embryos, YFP+ Ascl1 lineage cells are neurons (NeuN+) and some express the glutamatergic marker Brn3a (arrowheads indicate co-expressing cells, arrows indicate no co-expression). (F–H) X-gal stained coronal sections of superior and inferior colliculi from rostal to caudal (from F to H). Ascl1-CreER™;R26R-stop-lacZ embryos were exposed to tamoxifen as indicated and harvested at E18.5. (I) Schematic view of sectioning plane for panels in (F–H”). (J–K) P30 brains of Ascl1-CreER™;R26R-stop-lacZ showed sequential contribution of the Ascl1 lineage to superior and inferior colliculi from early versus late embryogenic stages. IC, inferior colliculus; Me5, mesencephalic trigeminal nucleus; SC, superior colliculus. Scale bars = 20µm for C–E, 200µm for A–B, F–K.
Figure 6
Figure 6. The Ascl1 lineage generates Purkinje cells, deep cerebellar nuclei interneurons and oligodendrocytes at specific stages in the cerebellum
(A) Diagram depicting E12.5 cerebellum primodium for panels (B–D). Progenitors from the ventricular zone migrate to the cortical transitory zone (CTZ), whereas progenitors from the rhombic lip migrate to the nuclear transitory zone (NTZ). (B–D) Ascl1 is in the ventricular zone (VZ) distinct from Atoh1 in rhombic lip (RL). (C) Transient expression of Ascl1 is not overlapped by CTZ marker Lhx1/5 or NTZ marker Lhx2/9. (D) Ascl1 and Ptf1a are co-expressed in VZ. (E–H) Ascl1-CreER™;R26Rstop-lacZ embryos exposed to tamoxifen at E12.5 and harvested at E13.5 (E), at E17.5 (F,H) or P30 (G). The identity of Purkinje cells are confirmed with a magnified view showing the morphology of Purkinje cells (G’) at P30 or with co-expression of Purkinje cell marker Calbindin (H). (I) Diagram depicting E14.5/E15.5 cerebellum primodium. (J) Ascl1 expression in the VZ of the E15.5 cerebellum. (K) Coronal section of cerebellum with Purkinje cell layer (P) and three deep cerebellar nuclei (L,I,M) at E17.5. (L) β-gal+ Ascl1 lineage cells marked at E14.5 populate all three DCN nuclei, and co-label with neuronal marker NeuN (M) and interneuron marker Pax2 (N). (O) Diagram depicting E17.5 cerebellum primodium. (P) Scattered expression of Ascl1 progenitors in E17.5 cerebellum co-express oligodendrocyte marker Olig2 (P’). (Q–S) Ascl1 progenitors marked at E17.5 and detected at P4 in Ascl1-CreER™;R26R-stop-YFP cerebellum shows most of the Ascl1 lineage in white matter (Q) and co-express Sox10 (R) and PDGFRα (S). (T) Summary diagram depicting temporal specific contribution of Ascl1 lineage cells in cerebellum. CTZ, cortical transitory zone; DCN, deep cerebellar nucleus; GCL, granule cell layer; I, interposed DCN; L, lateral DCN; M, medial DCN; NTZ, nuclear transitory zone; P, Purkinje cells; RL, rhombic lip; VZ, ventricular zone; wm, white matter. Scale bars = 20µm for B–D, H, J, M–S and 200µm for E–F, L.
Figure 7
Figure 7. Ascl1 lineage in the trigeminal sensory system in the brainstem
(A) Diagram of an E12.5 embryo depicting section planes in hindbrain regions shown in (B–D). (B) Ascl1 is restricted to the ventricular zone around the fourth ventricle whereas β-gal marked Ascl1 lineage cells from E12.5 in Ascl1-CreER™;R26R-stop-lacZ embryos are found in the mantle zone by E13.5. (E–I) YFP+ Ascl1 lineage cells in Ascl1-CreER™;R26R-stop-YFP treated with tamoxifen at E10.5 and harvested at E11.5 are dB3 neurons as indicated by co-expression with Tlx3 (H) and Lmx1b (G), but not Pax2 (H) or Lhx1/5 (I). (J) Summary of neuronal subtypes and transcription factors for early (dA1–dB4) and late (dBLa and dBLb) neurogenesis in rhombomere 7 (Sieber et al., 2007). (K–N’) In Ascl1-CreER™;R26R-stop-lacZ embryos, tamoxifen was administered at E10.5 (K–N) and E12.5 (K’–N’), and harvested 24 hours later (K, K’) or at E18.5 (L–N’). (O) Diagram depicting E18.5 embryo brainstem with section plane used in panels (L–N’) shown. (L”–N”) Diagrams of coronal sections of hindbrain showing precerebellar nuclei. 4v, fourth ventricle; CN, cochlear nucleus; ECN, external cuneate nucleus; Gi, gigantocellular reticular nucleus; ION, inferior olive nucleus; LPGi, lateral paragigantocellular nucleus; LRL, lower rhombic lip; LRt, lateral reticular nucleus; MZ, mantle zone; Sp5, spinal trigeminal nucleus; PCRtA, parvicellular reticular nucleus, alpha part; PN, pontine nuclei; Pr5, the primary sensory trigeminal nucleus; Rtgn, reticulotegmental nucleus; URL, upper rhombic lip; VM, medial vestibular nucleus; Vsp, spinal vestibular nucleus; VZ, ventricular zone. Scale bars = 20µm for B, E–I, 200µm for C, K–N’.

Similar articles

Cited by

References

    1. Altman J, Bayer SA. Time of origin of neurons of the rat inferior colliculus and the relations between cytogenesis and tonotopic order in the auditory pathway. Experimental brain research. Experimentelle Hirnforschung. 1981a;42:411–423. - PubMed
    1. Altman J, Bayer SA. Time of origin of neurons of the rat superior colliculus in relation to other components of the visual and visuomotor pathways. Experimental brain research. Experimentelle Hirnforschung. 1981b;42:424–434. - PubMed
    1. Altman J, Bayer SA. Embryonic development of the rat cerebellum. II. Translocation and regional distribution of the deep neurons. The Journal of comparative neurology. 1985a;231:27–41. - PubMed
    1. Altman J, Bayer SA. Embryonic development of the rat cerebellum. III. Regional differences in the time of origin, migration, and settling of Purkinje cells. The Journal of comparative neurology. 1985b;231:42–65. - PubMed
    1. Altman J, Bayer SA. Embryonic development of the rat cerebellum: deliniation of the cerebellar primordium and early cell movements. J. Comp. Neurol. 1985c;231:1–26. - PubMed

Publication types

MeSH terms

Substances