. 2008 Jul 18;29(1):90-100.
doi: 10.1016/j.immuni.2008.04.022. Epub 2008 Jun 26.

Thymic selection determines gammadelta T cell effector fate: antigen-naive cells make interleukin-17 and antigen-experienced cells make interferon gamma

Affiliations

Thymic selection determines gammadelta T cell effector fate: antigen-naive cells make interleukin-17 and antigen-experienced cells make interferon gamma

Kirk D C Jensen et al. Immunity. .

Abstract

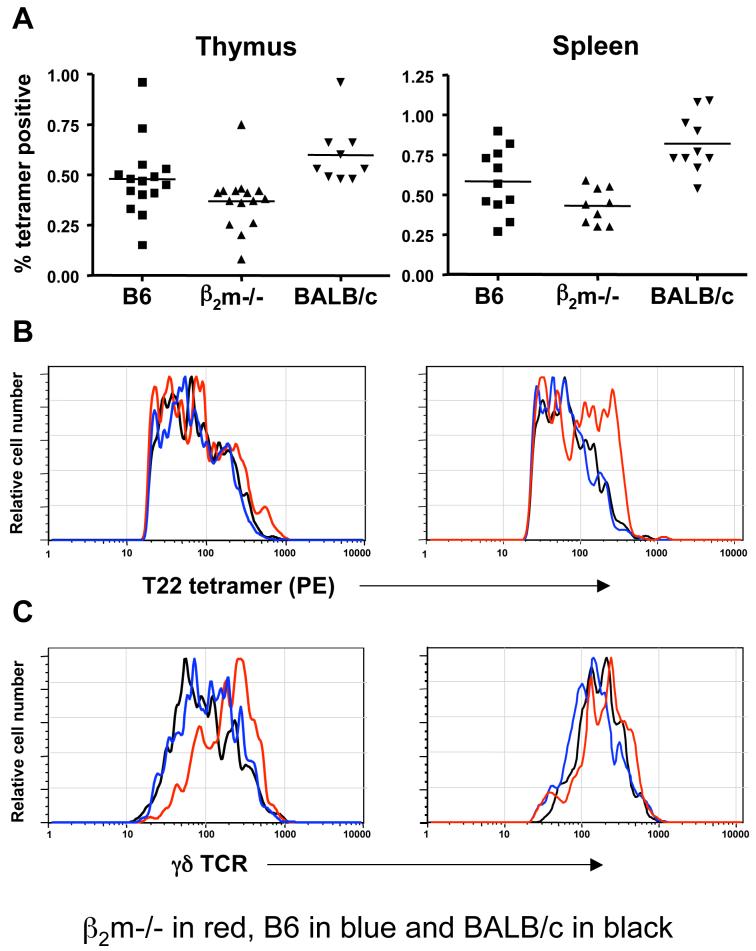
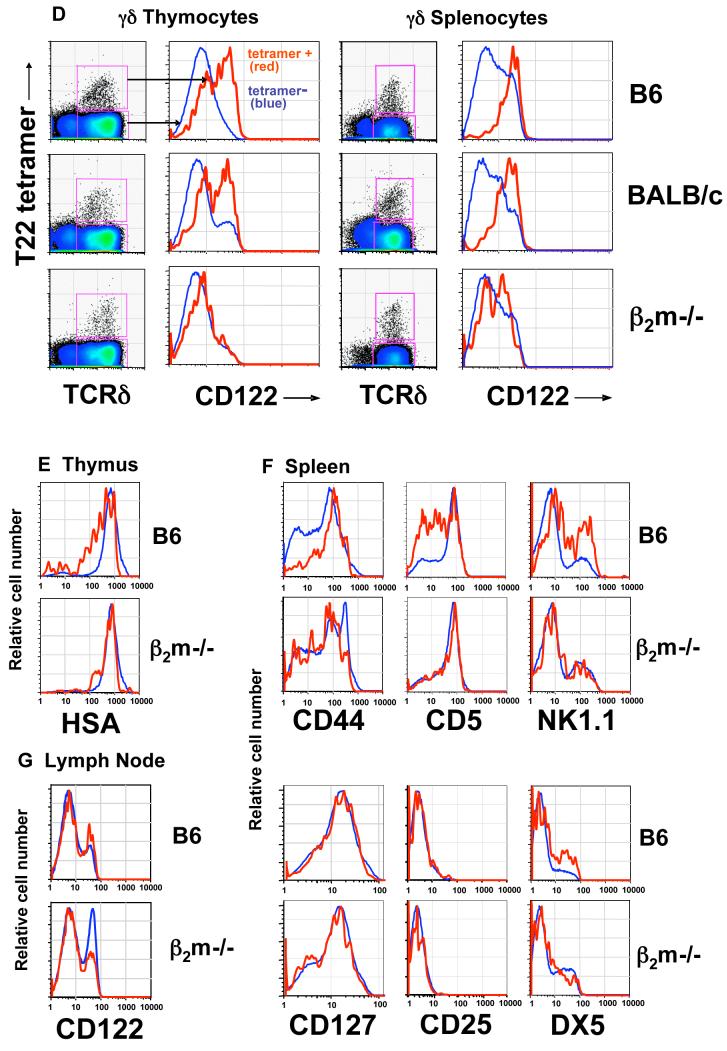
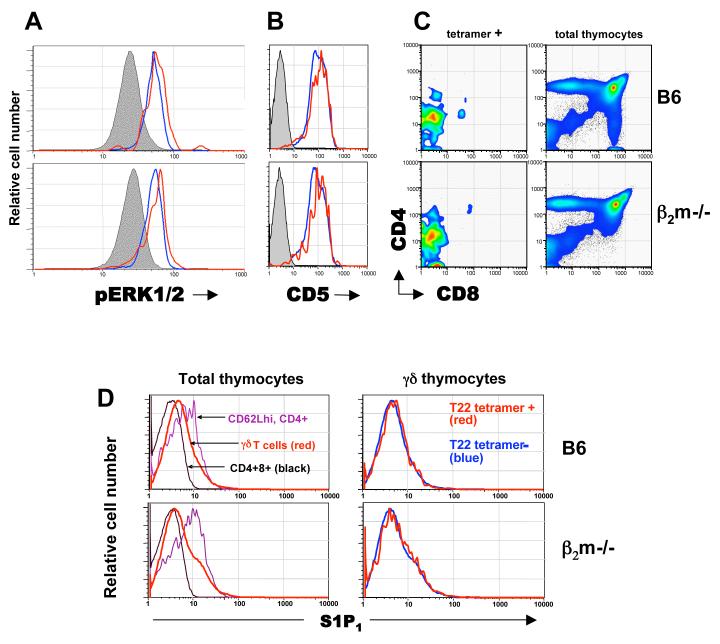
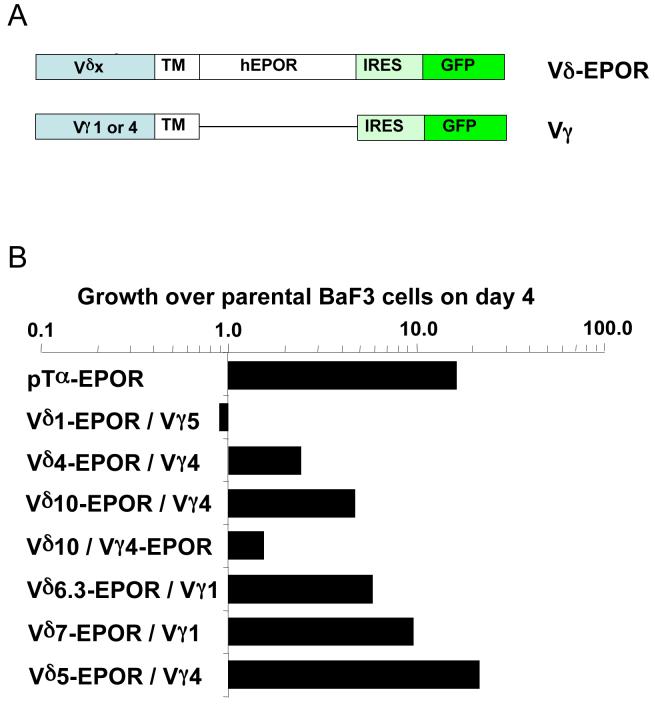
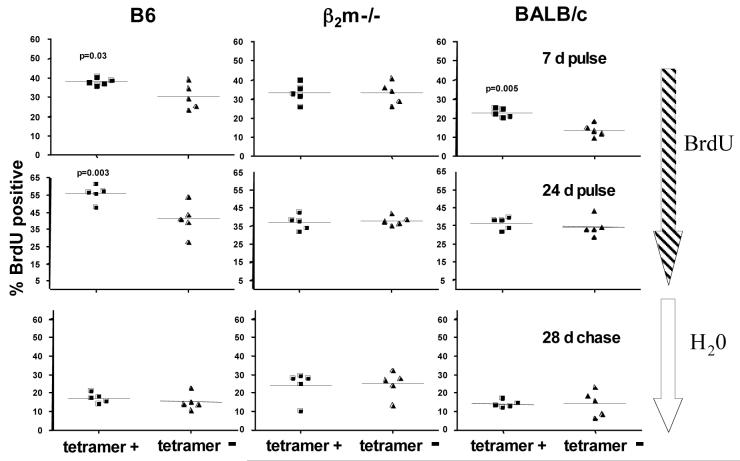
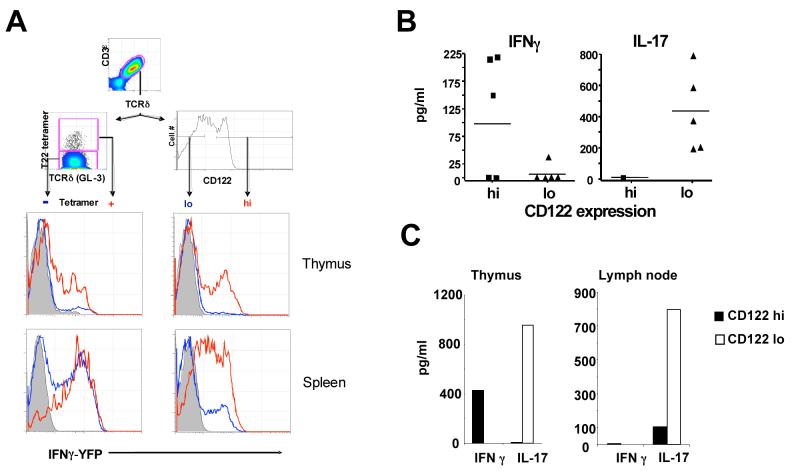
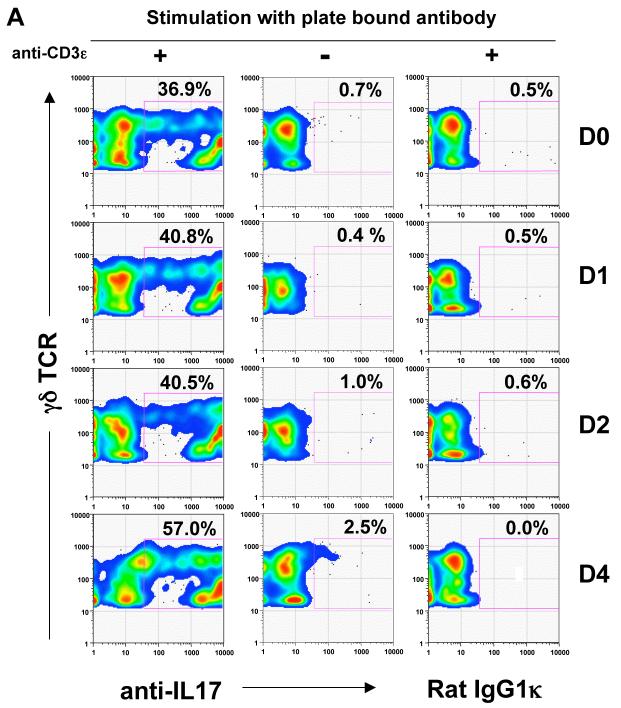
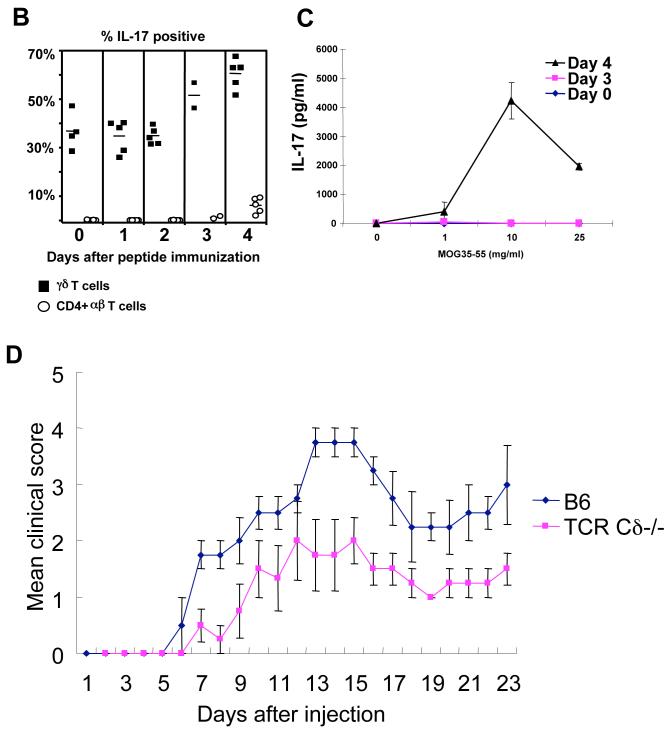
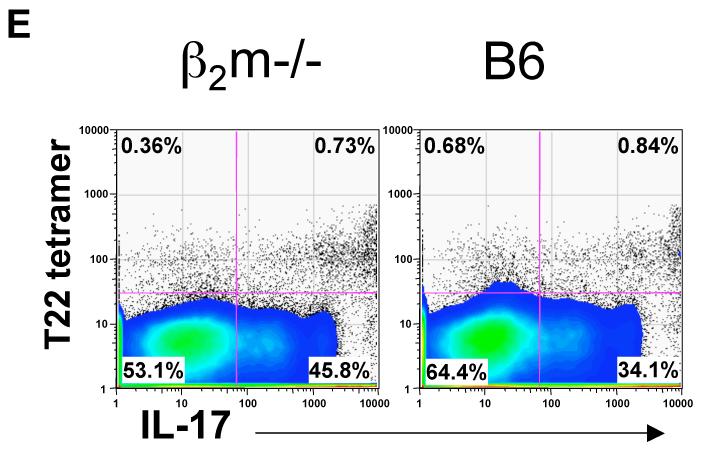
gammadelta T cells uniquely contribute to host immune defense, but how this is accomplished remains unclear. Here, we analyzed the nonclassical major histocompatibility complex class I T10 and T22-specific gammadelta T cells in mice and found that encountering antigen in the thymus was neither required nor inhibitory for their development. But when triggered through the T cell receptor, ligand-naive lymphoid-gammadelta T cells produced IL-17, whereas ligand-experienced cells made IFN-gamma. Immediately after immunization, a large fraction of IL-17(+) gammadelta T cells were found in the draining lymph nodes days before the appearance of antigen-specific IL-17(+) *beta T cells. Thus, thymic selection determines the effector fate of gammadelta T cells rather than constrains their antigen specificities. The swift IL-17 response mounted by antigen-naive gammadelta T cells suggests a critical role for these cells at the onset of an acute inflammatory response to novel antigens.


Figures

Figure 1
Figure 1. Frequency and surface phenotypes of T10/T22-specific γδ T cells from mice with and without T10/T22 expression
(A) Frequency; (B) tetramer staining intensity; and (C) TCR levels of T10/T22 specific γδ thymocytes (left column) and splenocytes (right column) from C57BL/6 (B6) (T10+T22+) (blue), C57BL/6 β2m-/- (T10-T22-) (red) and BALB/c (T10+T22-) (black) mice. Each symbol or histogram represents the result of one mouse. (D) Representative FACS analysis of tetramer positive (red) and tetramer negative (blue) γδ thymocytes and splenocytes for the expression of CD122 (IL-2/IL-15R β chain) from B6, BALB/c and β2m-/- mice. (E) γδ hymocytes, (F) γδ splenocytes and (E) lymph node γδ T cells from B6 and β2m-/- mice for the expression of surface markers commonly associated with antigen recognition by T cells. γδ T cells were first enriched with the pan-γδ antibody GL-3, followed by staining with PE labelled T22 tetramer, antibodies to cell surface markers and Cy5PE labelled anti- CD19, anti-TCRβ, Armenian Hamster isotype IgG2κ, streptavidin and propidium iodide (PI) as described in Experimental Procedures. Cy5PE and PI positive cells were excluded from analysis. Representative histogram plots are shown (n≥3).
Figure 2
Figure 2. Host T10/T22 expression does not affect signalling, lineage commitment and S1P1 levels of T10/T22-specific γδ thymocytes
Representative FACS analysis of direct ex vivo γδ thymocytes (n=3), (A) Intracellular expression of phosphorylated ERK1/2 in tetramer+ (red), total γδ thymocytes (blue) and CD4+8+ thymocytes (shaded). (B) CD5 expression on tetramer+ (red) and tetramer- (blue) γδ hymocytes, isotype control on GL-3+ γδ thymocytes (shaded). (C) CD4 and CD8 expression on tetramer positive GL-3+ γδ thymocytes (left column), or total thymocytes (right column) from B6 and β2m-/- mice. (D) Sphingosine-1 Phosphate receptor-1 (S1P1) surface expression on CD4+CD8+ (black), mature CD4+CD62Lhi αβ T cells that have gone through positive and negative selection and ready for thymic exit (purple), GL-3+ γδ thymocytes (red) (left column); or tetramer positive (red) and negative (blue) GL-3+ γδ thymocytes (right column) from B6 and β2m-/- mice. S1P1 expression was identified with a polyclonal rabbit antiserum to S1P1 (Jason Cyster, UCSF) and detected with donkey anti-rabbit IgG FITC.
Figure 3
Figure 3. TCRδ-δ interactions as assayed by the induction of BaF3 cell autonomous growth
(A) Schematic representation of TCR-EPOR chimeric genes. The TCRγ chain is fused to the transmembrane region of the human EPOR but lacking the cytoplasmic hEPOR domain, whereas TCRδ is fused to the transmembrane and cytoplasmic domains of the hEPOR (also see Experimental Procedures). (B) γδ TCR-EPOR mediated signaling allows BaF3 cell growth in the absence of IL-3. The relative growth of TCR-EPOR expressing BaF3 cells to parental BaF3 cells day 4 after IL-3 withdraw. Ratios defined as: [number of chimeric EPOR transfectants at day 4 after IL-3 removal / number of transfectants at day 0] / [number of parental BaF3 cells at day 4 after IL-3 removal / number of parental BaF3 cells at day 4]. The survival curves of the TCR expressing BaF3 cells are shown in supplementary Figure S2. pTα-EPOR as previously reported induces BaF3 cell growth (Yamasaki et al., 2006) and serves as a positive control. The Vδ10/Vγ4 G8 TCR was assayed two different ways: Vδ10-EPOR/Vγ4 and Vγ4-EPOR/Vδ10. Consistent with the crystal structure of G8 (Adams et al., 2005), the Vδ chain mediates dimerization, Vδ10-EPOR/Vγ4 signals better than Vγ4-EPOR/Vδ10.
Figure 4
Figure 4. Host T10/T22 expression enhances T10/T22-specific γδ T cell turnover but does not fix this specificity in the repertoire
Turnover rates of tetramer positive and negative γδ splenocytes from B6, β2m-/- and BALB/c mice. The percentage of BrdU+ cells among tetramer positive or negative γδ plenocytes were analyzed by intracellular BrdU staining as described in Experimental Procedures after mice were fed with 0.8 mg/ml BrdU in their drinking water for 7 days (upper panels), 24 days (middle panels) or chased with normal drinking water for 28 days after the 24-day labeling phase (lower panels). Each dot represents the analysis of one mouse. Data was analyzed by a paired, two-tailed student t test.
Figure 5
Figure 5. γδ T cell functional subsets
(A) γδ hymocytes (upper row) and splenocytes (lower row) from YETI (Yellow Enhanced Transcript for IFNγ) mice (H-2b, T10+T22+) were analyzed for YFP (IFNγ) expression in tetramer+ (red) and tetramer- (blue) cells (left column); or CD122hi (red) and CD122lo (blue) cells right column (n=3); total γδ thymocytes or splenocytes from YFP negative littermate controls were also analyzed (shaded). FACS analysis was performed as described in Fig. 1. (B) IFNγ and IL-17 production by CD122hi and CD122lo γδ plenocytes, (C) γδ thymocytes and γδ lymph node cells were FACS sorted into CD122hi and CD122lo populations according to the indicated gate in (A), and stimulated with plate bound anti-TCRδ (GL-4) for 40 hours. Supernatants were assayed for the production of IFNγ and IL-17 by ELISA. In (B) each symbol represents the result of one mouse, in (C) a representative graph.
Figure 6
Figure 6. IL-17+ T cells from draining lymph nodes after peptide/CFA immunization
(A) Representative intracellular IL-17 staining of γδ T cells (GL-3+CD3ε+) and; (B) Percentage of IL-17+ cells among total γδ T cells (■) or CD4+CD8- αβ T cells (CD3ε+) (○) from the draining lymph nodes at the indicated days after CFA/MOG35-55 immunization. Each symbol represents the result of one mouse. Lymph node cells were isolated and stimulated with (+) or without (-) plate bound anti-CD3ε for 24 hours followed by staining with antibodies against CD4, CD8α, CD3ε, TCRδ, F4/80, CD11b, Gr-1 and CD19 and for intracellular IL-17 as described in Experimental Procedures. F4/80, CD11b, Gr-1 and CD19 positive cells were excluded from analysis. (C) Representative dose response curves of the MOG33-55 specific IL-17 response at days 0, 3, and 4 after immunization. Lymph node cells were isolated from individual mice and incubated with various concentrations of MOG33-55 peptide for 48 hours and assayed for IL-17 in the supernatant. (D) Progression of EAE disease in TCR Cδ-/- and B6 mice after immunization with MOG33-55 and pertussis toxin. The daily mean clinical score of each group is plotted (see Experimental Procedures). (F) IL-17 response of T10/T22-specific γδ T cells from β2m-/- or B6 mice 4 days after MOG33-55/CFA immunization, draining lymph node cells from 12 β2m-/-, or B6 mice were pooled and stimulated as in 6A. γδ T cells were enriched, stained with T22 tetramer and assayed for intracellular IL-17 or stained with Rat IgG1κ isotype control (data not shown). Dot plots display gated GL-3+ H57- CD11b- F4/80- Gr1- CD19- γδ T cells.

Comment in

Similar articles

Cited by

References

    1. Adams EJ, Chien YH, Garcia KC. Structure of a gammadelta T cell receptor in complex with the nonclassical MHC T22. Science. 2005;308:227–231. - PubMed
    1. Azzam HS, Grinberg A, Lui K, Shen H, Shores EW, Love PE. CD5 expression is developmentally regulated by T cell receptor (TCR) signals and TCR avidity. J Exp Med. 1998;188:2301–2311. - PMC - PubMed
    1. Baccala R, Witherden D, Gonzalez-Quintial R, Dummer W, Surh CD, Havran WL, Theofilopoulos AN. Gamma delta T cell homeostasis is controlled by IL-7 and IL-15 together with subset-specific factors. J Immunol. 2005;174:4606–4612. - PubMed
    1. Bettelli E, Oukka M, Kuchroo VK. T(H)-17 cells in the circle of immunity and autoimmunity. Nat Immunol. 2007;8:345–350. - PubMed
    1. Bonneville M, Ishida I, Itohara S, Verbeek S, Berns A, Kanagawa O, Haas W, Tonegawa S. Self-tolerance to transgenic gamma delta T cells by intrathymic inactivation. Nature. 1990;344:163–165. - PubMed

Publication types

MeSH terms